-
Voyager & Reader Control Software
The Reader Control software is an intuitive and easy-to-understand user interface to effortlessly define measurement protocols and acquire data. The Reader Control is an extremely versatile interface for the straightforward execution of routine tasks, as well as the optimisation of more complex operations.
For the VANTAstar and CLARIOstar Plus plate readers, BMG LABTECH also offers the newly released Voyager interface. Voyager is an intuitive ‘drag & drop’ system that simplifies data acquisition.
With Voyager, BMG LABTECH´s new microplate reader control interface, data acquisition is more intuitive than ever. Available for CLARIOstar Plus and VANTAstar, Voyager transforms the way users design protocols by removing complexity while maximising flexibility.
Setting up a detection protocol has never been quicker and easier with Voyager’s streamlined drag and drop system. This comprehensive platform allows full flexibility from straight-forward measurements to more demanding assays. As part of our multi-user software concept, Voyager can be installed on as many computers as the user requires, without the need to purchase additional licenses.
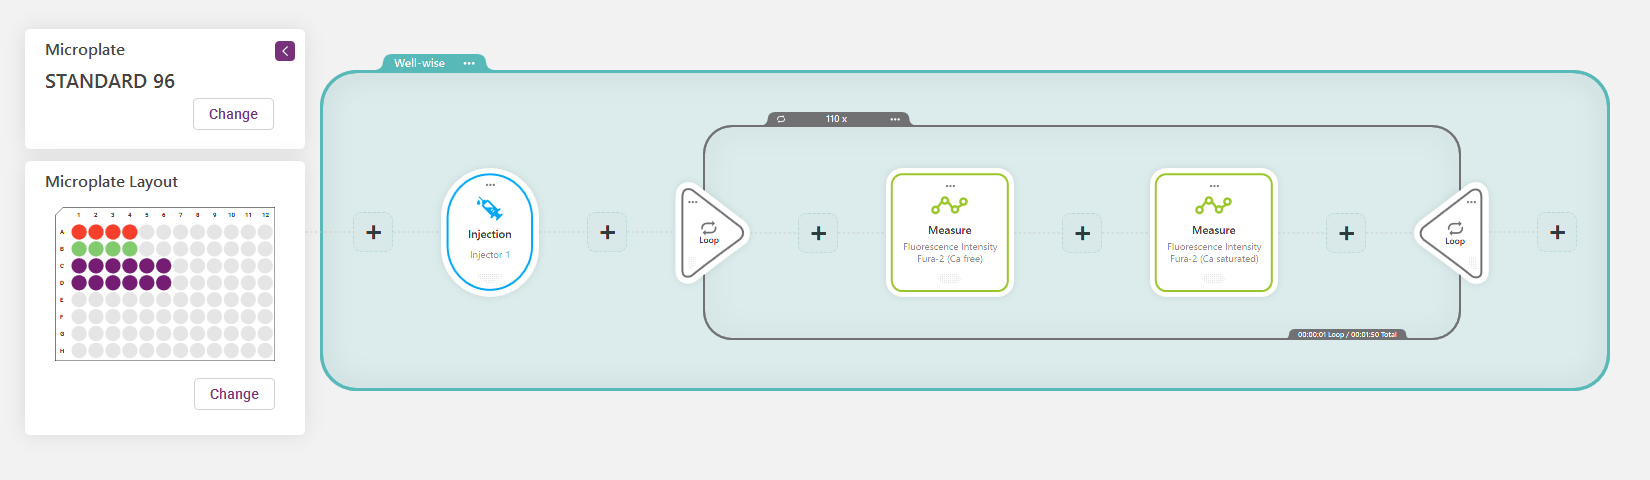
Drag and drop your detection protocol
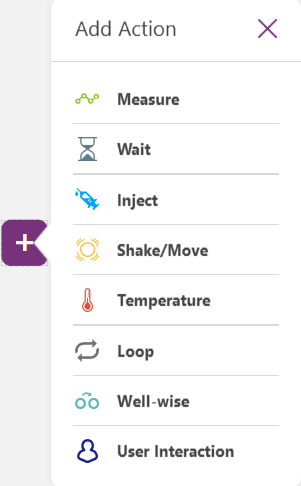
Voyager’s intuitive design allows to quickly identify and adapt all the existing components of a measurement protocol. The addition of further action elements, such as a additional detection modes, incubation or an injection step can be implemented without effort. Order or duration of the individual steps can be adjusted at any time. Multi-chromatic measurements in the same or with different detection modes can be easily defined in the same protocol without the need for complex, multi-stage setups.
Predefined protocols for a quick start
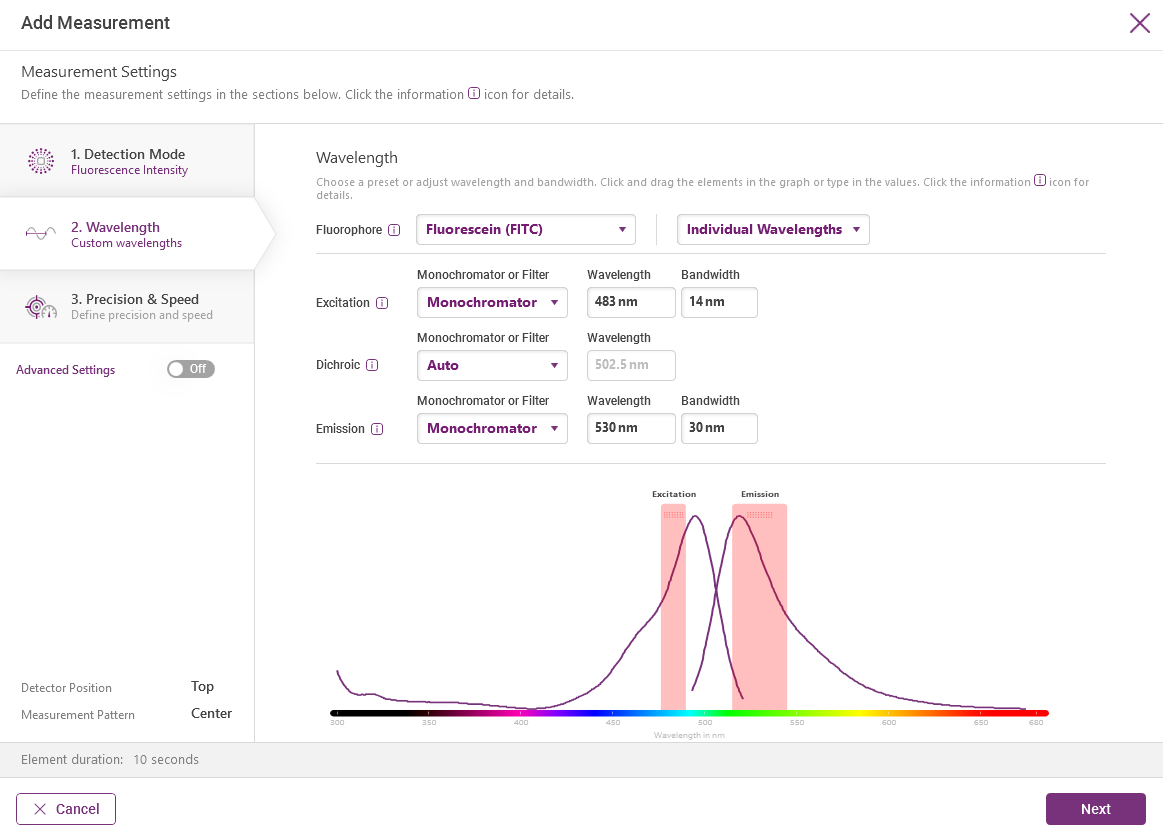
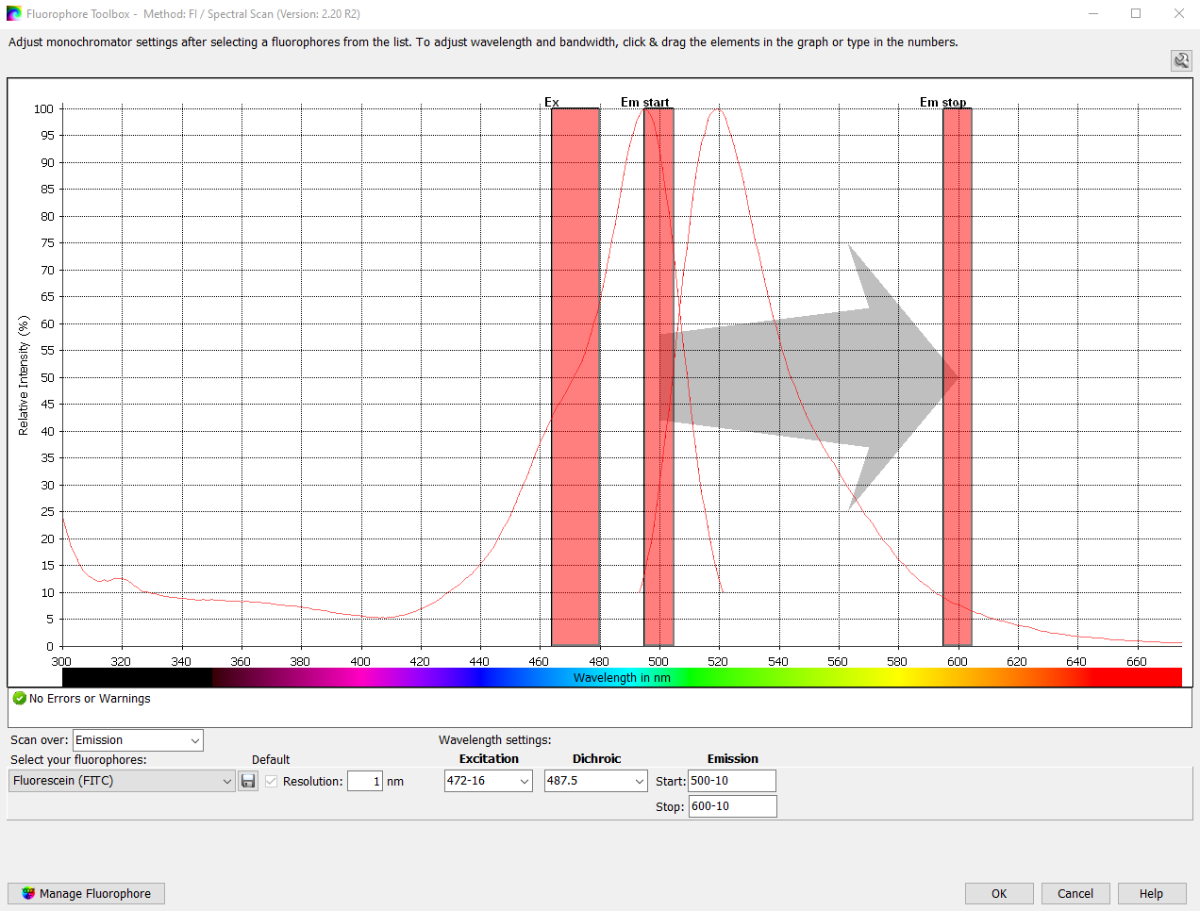
Preset detection protocols enable a quick and easy start as they already provide predefined detection settings for specific assays. Voyager comes with more than 30 pre-installed assay-dedicated detection protocols. Just select your protocol and you are good to go! Existing protocols can be further modified to fit similar assays, or new protocols can be created from scratch, depending on your needs. Predefined protocols include: DNA/RNA concentration, protein concentration (Lowry, Bradford, BCA), ELISAs, cell growth, NADH/NAD+ conversion, DLRTM, ADP-Glo®, LanthaScreen®, HTRF® cAMP and IP-One, LANCE®, AlphaScreen®, AlphaLISA®, calcium assays (Fura-2), GFP, ORAC, OD600 excitation and emission scans and AMC enzyme kinetics. The well-established fluorophore toolbox simplifies the identification of optimal filter settings and thus supports fast and effective protocol setup, even from scratch.
Full flexibility for complex tasks
Build your own bespoke detection workflows. Voyager supports endpoint and kinetic detection, multi-chromatics also using different detection modes, spectral scanning and multiple well scanning modes. In addition, reagent dispensing, gas (O2 and CO2), temperature and shaking are controlled by the interface. These actions can be included at any time in a workflow, significantly increasing flexibility.
Never lose track
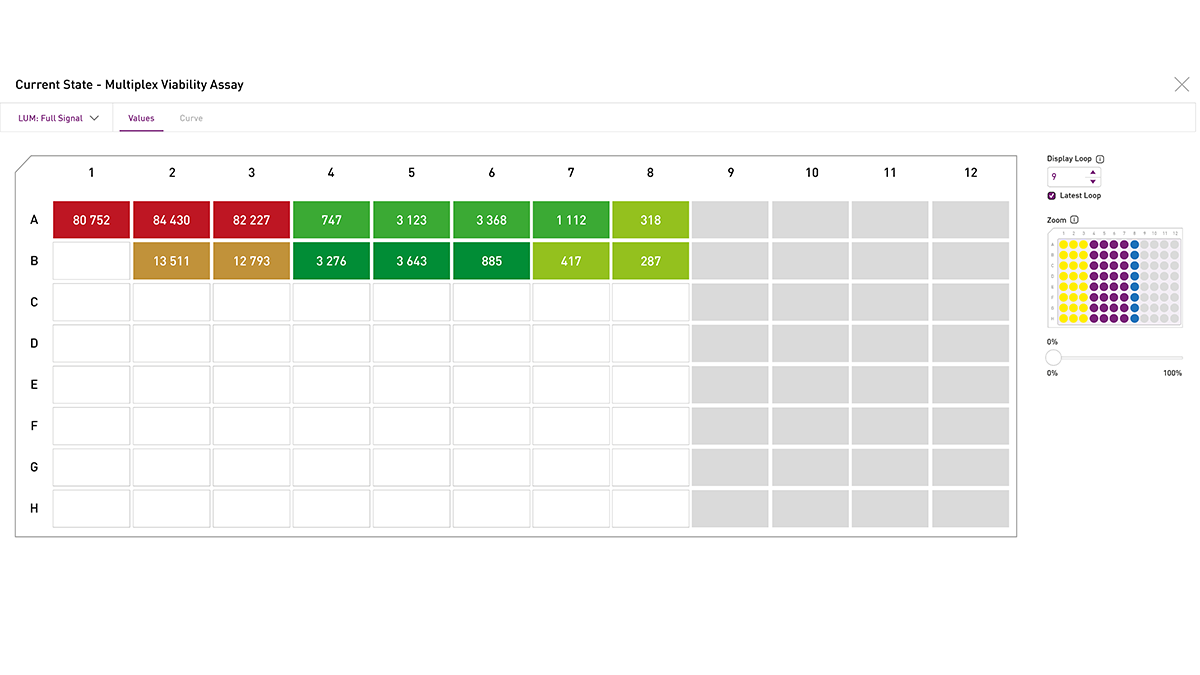
In the current state window Voyager allows you to watch your results unfold in real time. Monitor the generated results in real time in your preferred format and take action at any time if necessary. For multiplexing assays, simply switch back and forth between the channels. For kinetic assays, you can choose between monitoring kinetic curves that build up over time or the single values of each measurement loop.
Key features
The principal features of Voyager include:
- Interface to run the plate reader and acquire data
- More than 30 predefined assay protocols
- Create your workflows by dragging and dropping single actions
- Real-time data display during measurement
- Endpoint and kinetic detection
- Combined multi-detection (multichromatics) in one detection run
- Spectral scanning (absorbance, fluorescence, luminescence)
- One-click top/bottom reading switch
- Multiple well-scanning options for heterogeneous sample measurement
- Controls injectors, ACU, temperature and shaking
- Automatic data transfer to MARS data analysis software
- Data export to Excel
Compatibility
Voyager is compatible with all VANTAstars and with CLARIOstar Plus readers starting from serial number 430-4001. The software package included with every reader consists of Voyager, SMART Control and MARS data analysis interfaces. SMART Control and MARS are conceived to meet the FDA 21 CFR Part 11 guidelines.
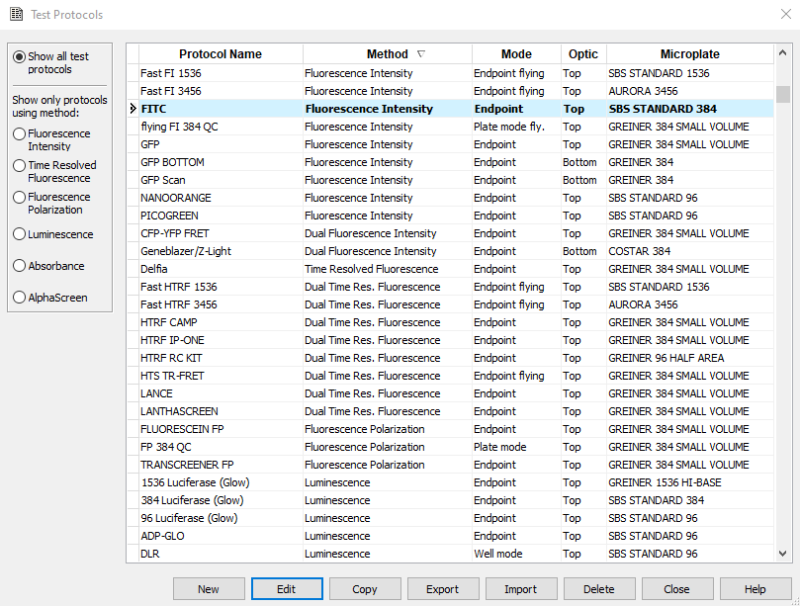
Ready to run with predefined protocols
The Reader Control comes with more than 30 predefined detection protocols already installed, enabling quick and easy access to the most commonly used applications. Existing protocols can be modified, or new protocols can be created, depending on the user's needs.
Predefined protocols include DNA/RNA concentration, protein concentration (Lowry, Bradford, BCA), ELISAs, cell growth, NADH/NAD+ conversion, DLRTM, ADP-Glo®, LanthaScreen®, HTRF® cAMP and IP-One, LANCE®, AlphaScreen®, AlphaLISA®, Transcreener®, calcium assays (FLuo3/4/8), GeneBLAzer®, PathHunter®, Picogreen®, GFP, and CFP-YFP.
Full flexibility for complex tasks
The Reader Control supports endpoint and kinetic detection, sequential and simultaneous multi-detection, spectral scanning and multiple well scanning modes. In addition, it controls reagent injectors, gas (O2 and CO2) and temperature, as well as shaking. A script wizard allows for the multiplexing of different measurement protocols and more complex operations.
Data analysis and export
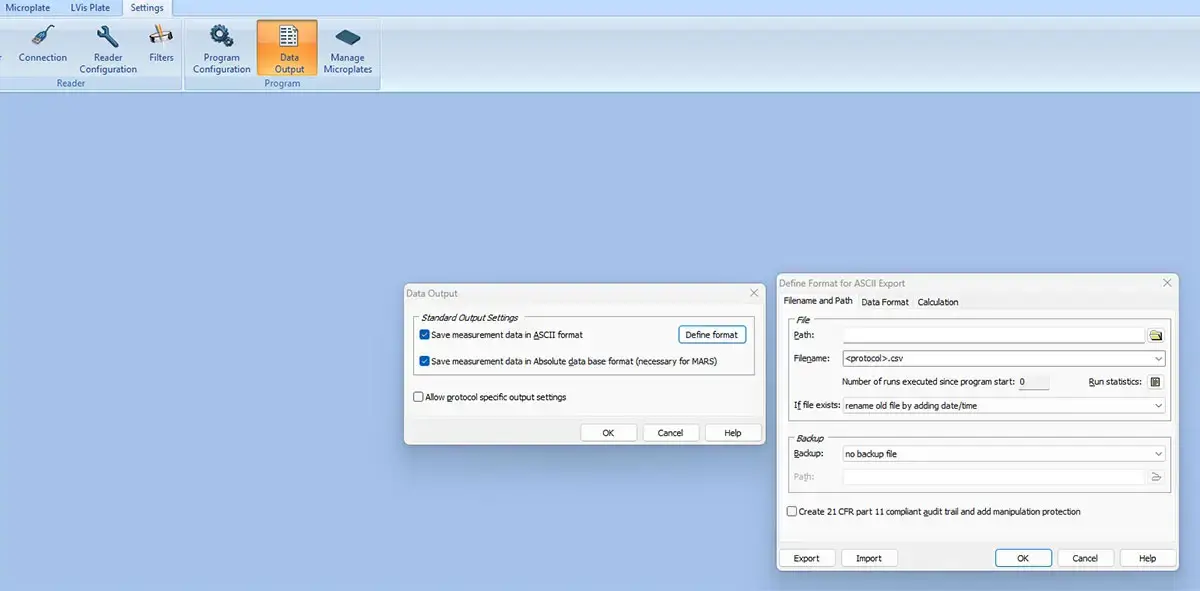
Once generated, data can be either analysed with the included MARS data analysis software or exported with one click as Excel®, Absolute Database or ASCII formats. ActiveX, DDE and SiLA interfaces guarantee an easy integration into LIMS systems.
Key features of Reader Control Software
- Interface to run the instrument and acquire data
- More than 30 predefined assay protocols
- Quick-start button to get started quickly
- Real-time data display during measurement
- Endpoint and kinetic detection
- Sequential and simultaneous multi-detection
- Spectral scanning (absorbance, fluorescence, luminescence)
- One-click top/bottom reading switch
- Multiple well-scanning options for heterogeneous sample measurement
- Controls injectors, gas, temperature and shaking
- Automatic data transfer to MARS data analysis software
- Data export to Excel, Absolute Database, or ASCII format
- ActiveX, DDE and SiLA interfaces for easy integration into LIMS systems
- ActiveX or DDE control for robotic integration
-
MARS Data Analysis Software
MARS is our intuitive data analysis software package, offering multiple data reduction possibilities. This interface is included with every BMG LABTECH reader and can be installed on as many computers as the user requires without the need to purchase additional licenses.
Key features of MARS Data Analysis Software
- Automated one-click assay analysis
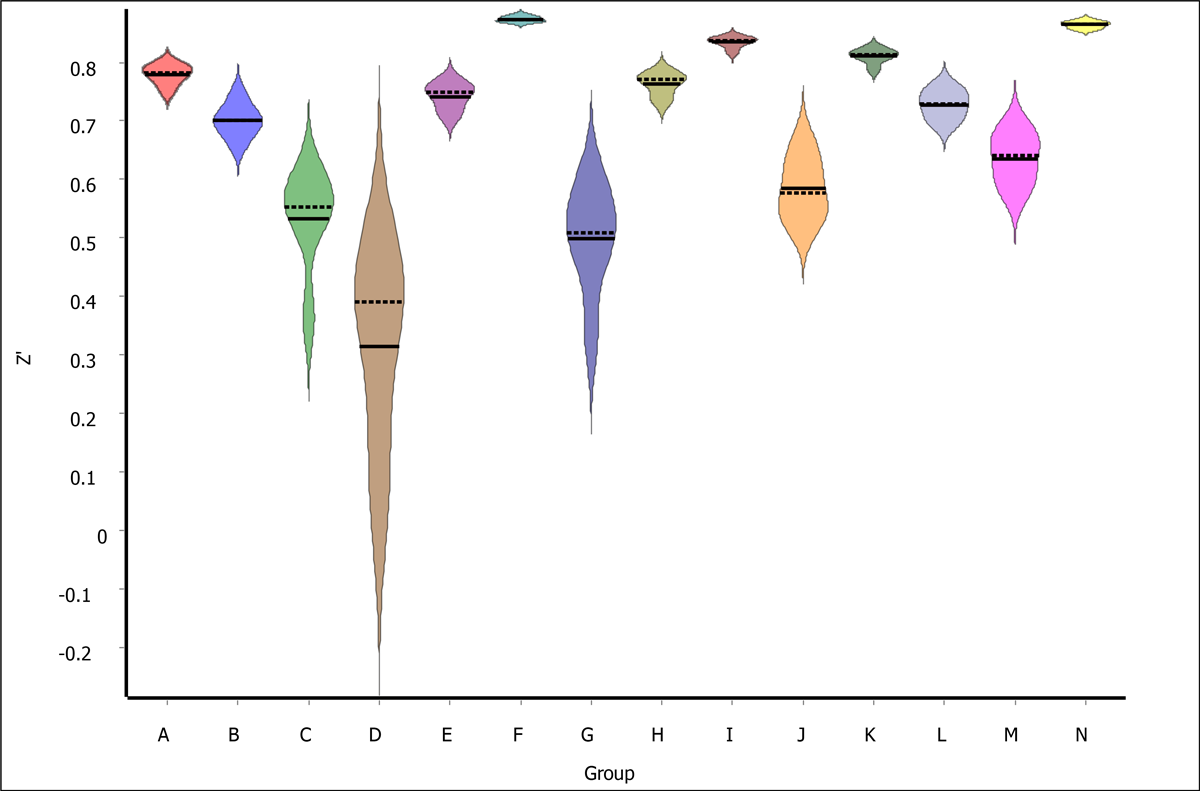
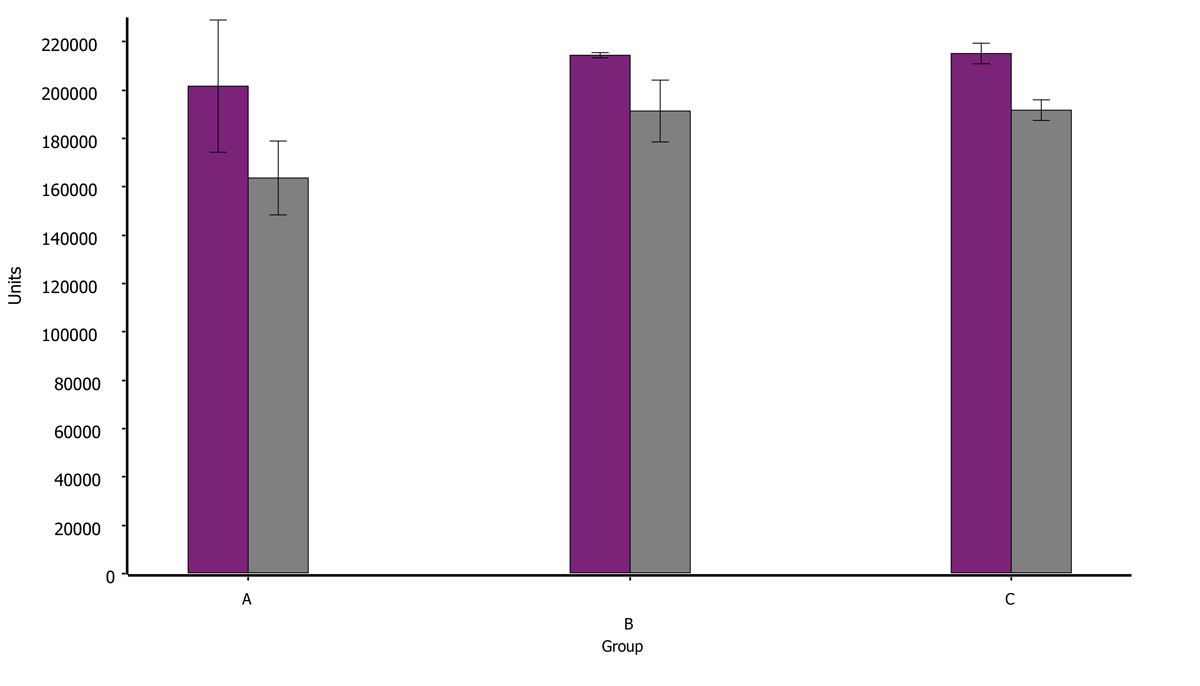
- Display data in bar charts, box plots, violin plots etc.
- Background and baseline removal
- UV/vis spectral view and analysis
- Signal interpolation using linear or cubic spline interpolation
- Noise removal by signal smoothing using moving averages or other methods
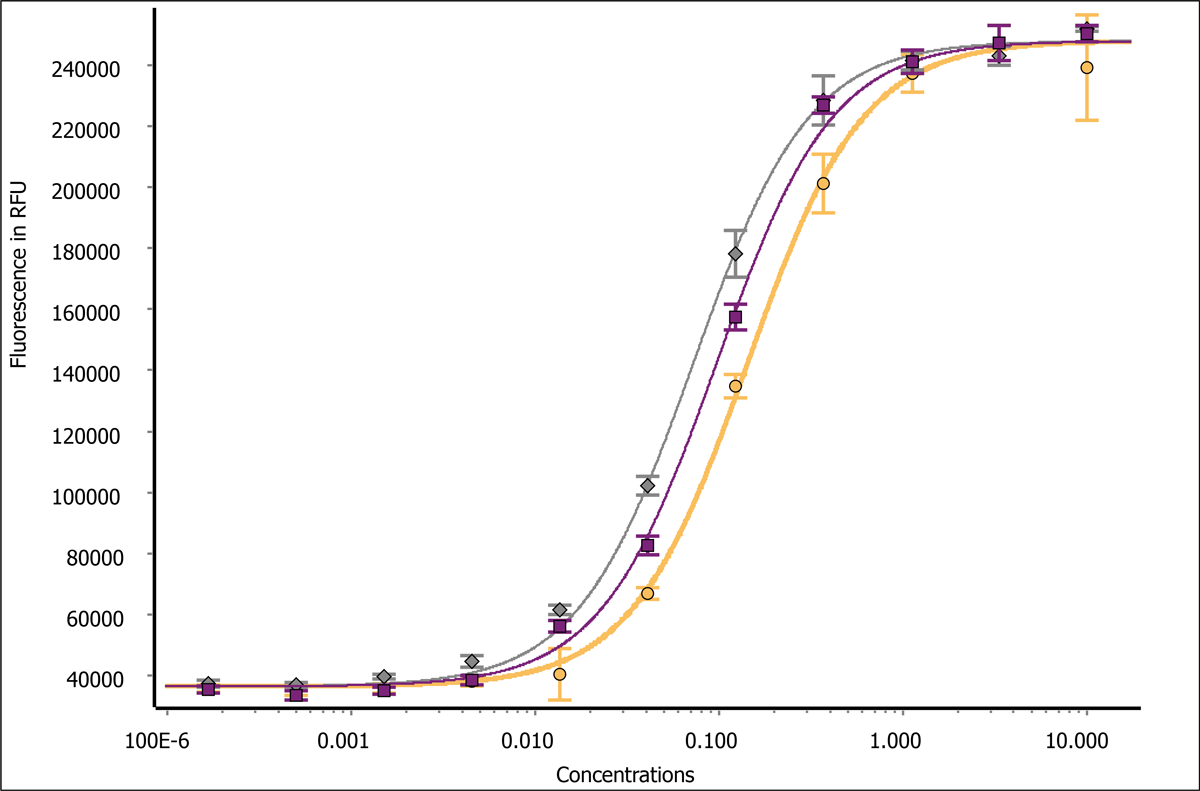
- Various curve fit models including linear, 4- / 5-parameter, polynomial and user-defined fit models
- Quantal Response Analysis, incorporating Spearman-Kärber analysis along with logit and probit regression, can be applied to various assays, such as RT-QuIC, to estimate the effective seeding dose.
- EC50 and ECX calculation including their confidence intervals
- Automatic DNA/RNA concentration determination.
- Advanced outlier identification (Grubbs-test, Dixon-Test etc.) including outlying kinetic curve identification
- Enzyme kinetic analysis using various models (e.g. Michaelis-Menten fit)
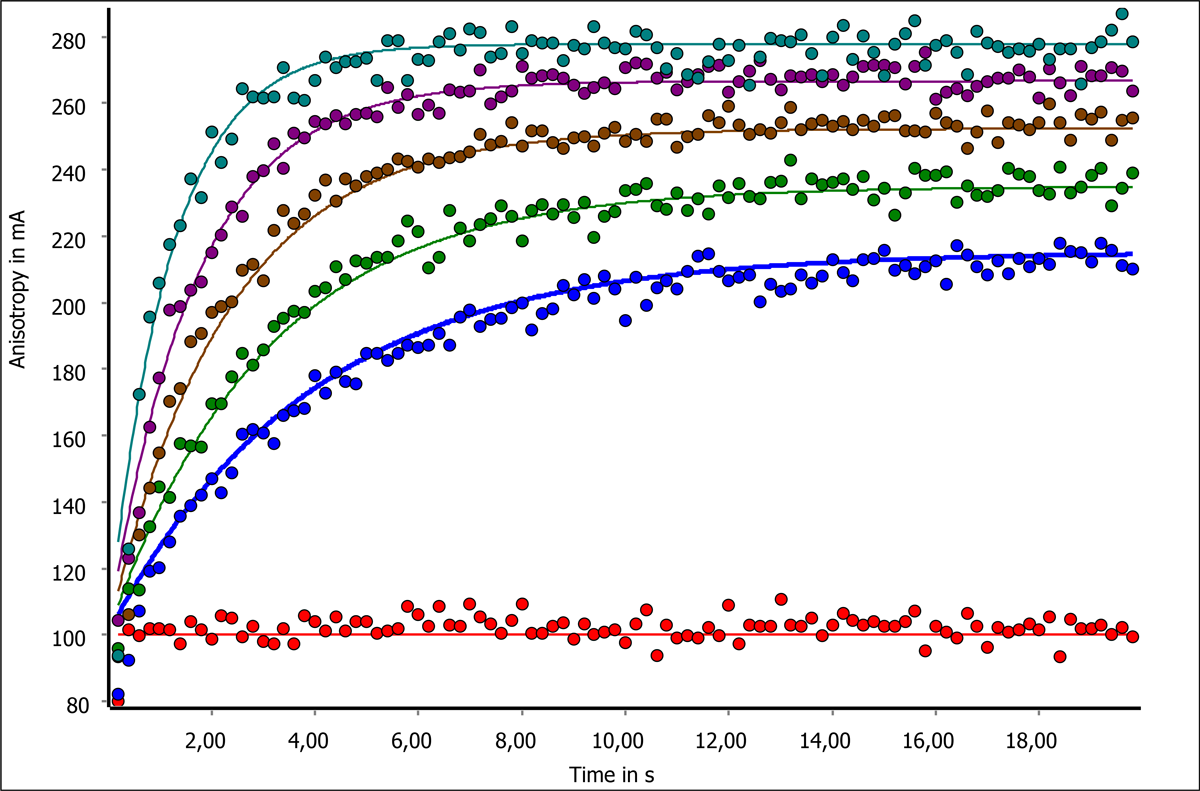
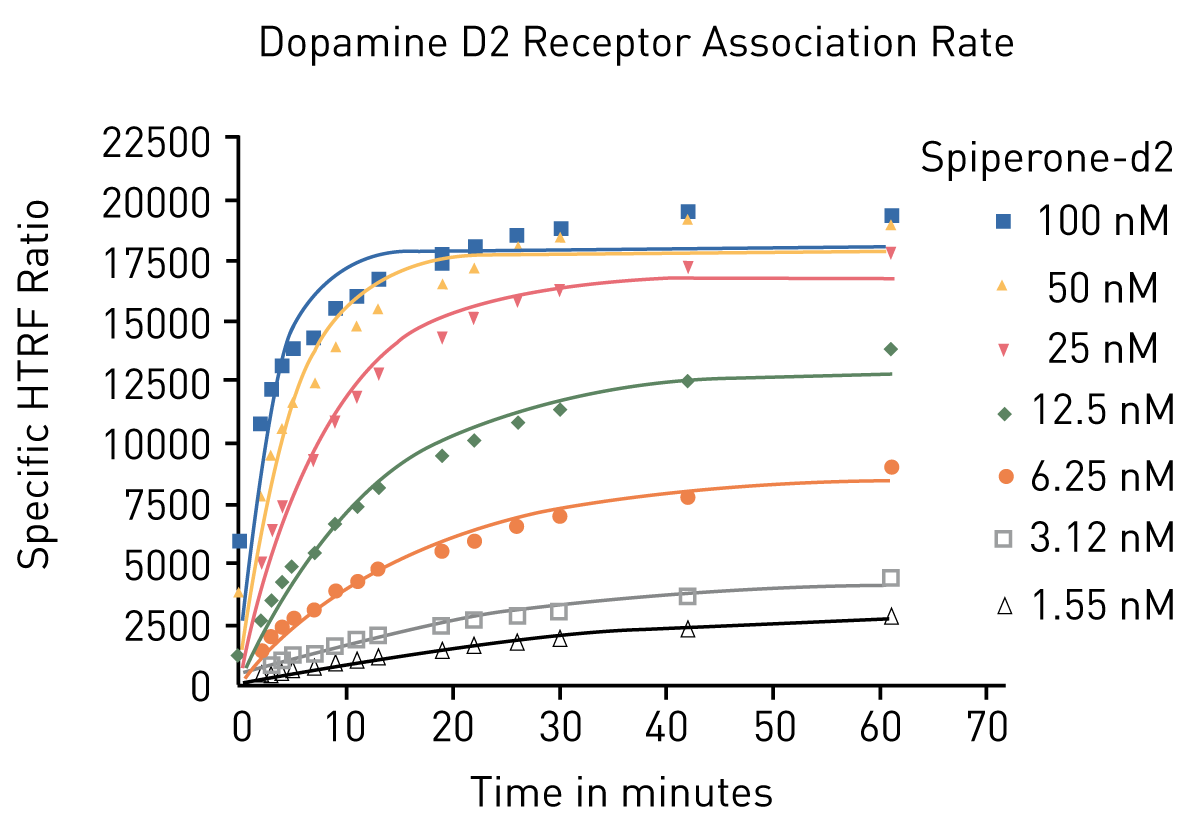
- Determine binding rates and binding constants using simple and advanced binding kinetic fit models
- Compare different groups by ANOVA, Student’s t-test, or multiple comparisons
- Relative potency calculation using parallel-line analysis (PLA)
- Design your own calculations / analyses using the user-defined formula generator
- Evaluate assay performance using Z-Prime, Delta F% for HTRF, Signal-to-Blank, Signal-to-Noise, CV, etc.
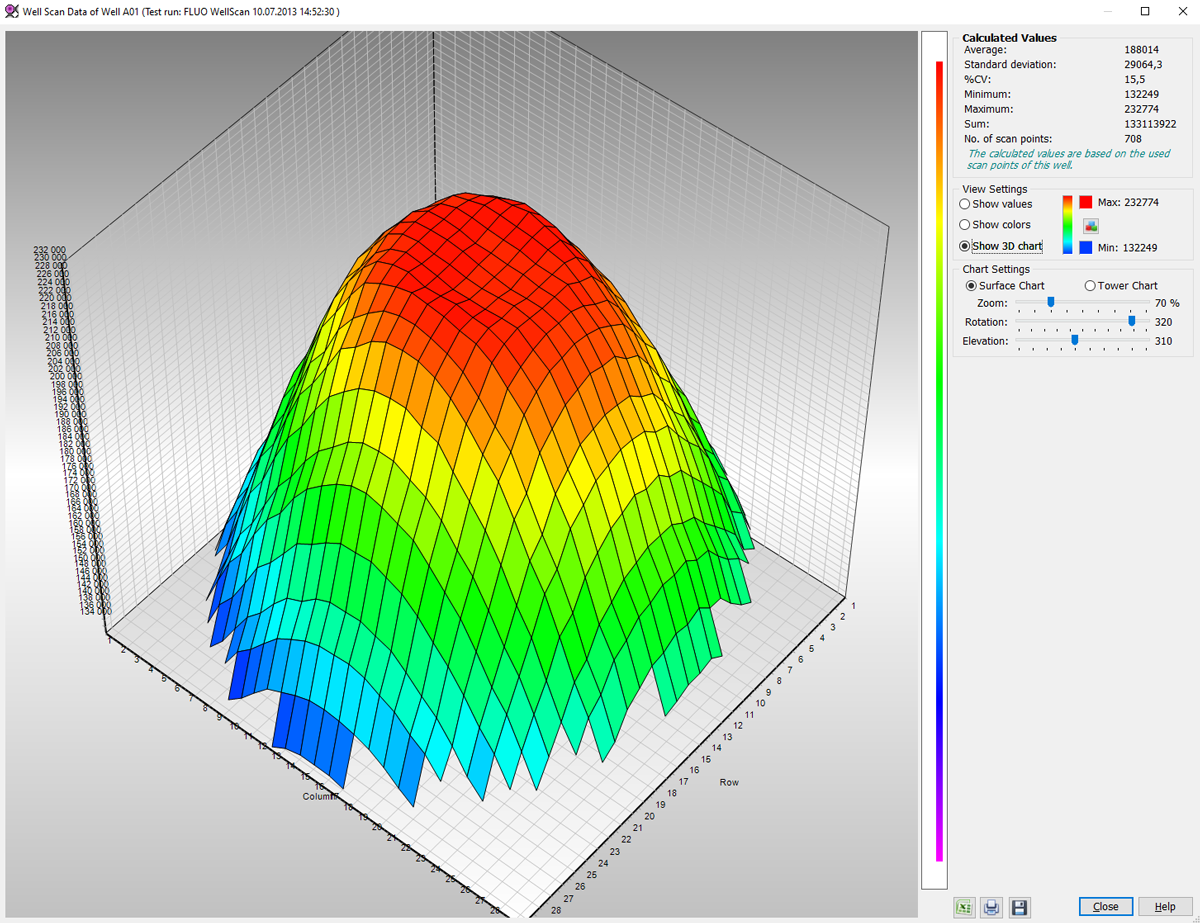
- 3D well-mapping, e.g., to find sample inhomogeneities
- Excel-, ASCII- and graphic export (in bitmap or vector graphic format)
- FDA 21 CFR part 11 compliant
- Customizable print report
- Comprehensive documentation
 Comprehensive data analysis package
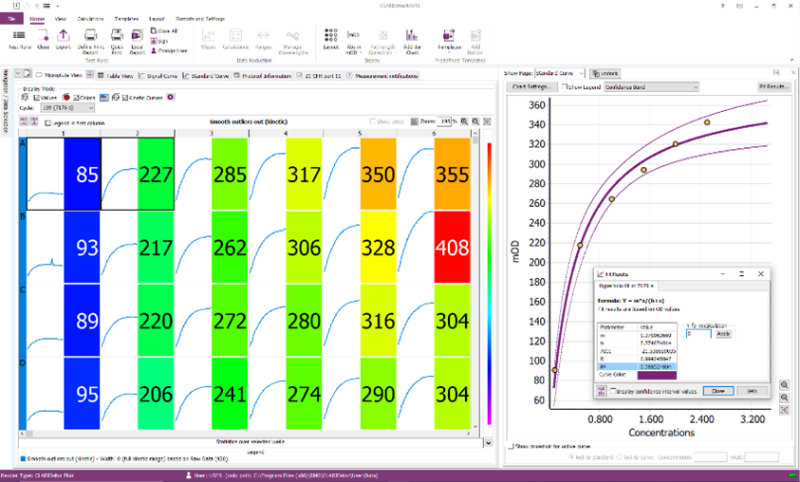
MARS is designed to make microplate reader data analysis simple and effective by displaying, extracting, and exporting information to make data reduction as effortless as possible.Explore your data for informed decisions
There are various ways to explore your data in MARS. The microplate view with numerical, graphical and heat map data representation capabilities allows for a quick overview of the data. Additionally, signal curves, bar charts, scatter-, box- or violin plots allow for graphical representation and first inferential analyses. The table view allows to categorize and sort the data but also to view, print and export it in its preferred format.
Determine sample concentrations with ease
Whether interpolating a standard curve to get unknown sample concentrations or modelling a biological system, MARS offers various fit and interpolation models including polynomial, 4P- / 5P or user-defined fit models. Curve interpolation and fitting is simplified by MARS’ unique curve fit wizard.
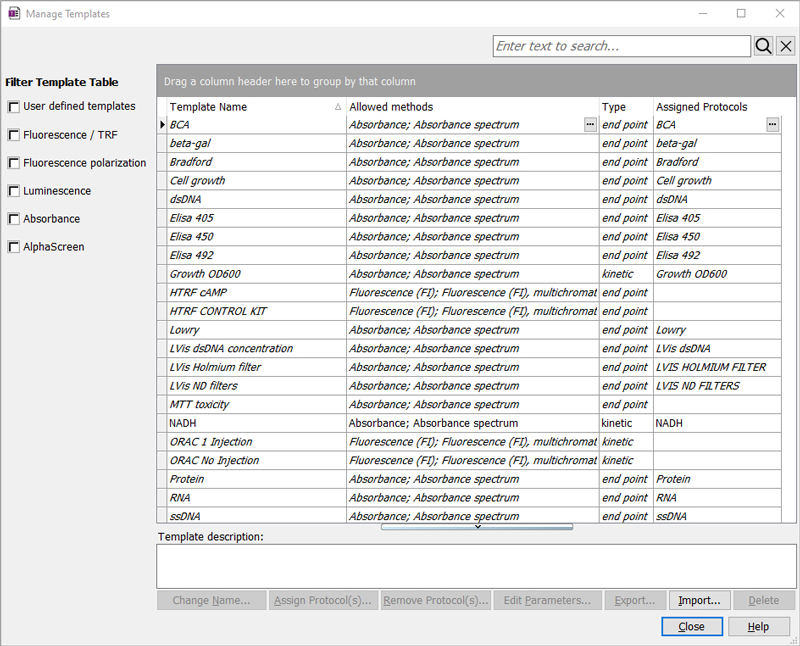
Automate your analysis workflows
To simplify data reduction after measurement, complex and assay-specific analyses and calculations can be created and saved in MARS as calculation templates. Templates can be linked to specific detection protocols, enabling data generation and analysis with just two mouse clicks. Templates can be exported to be shared with other MARS users and guarantee analysis and result conformity.
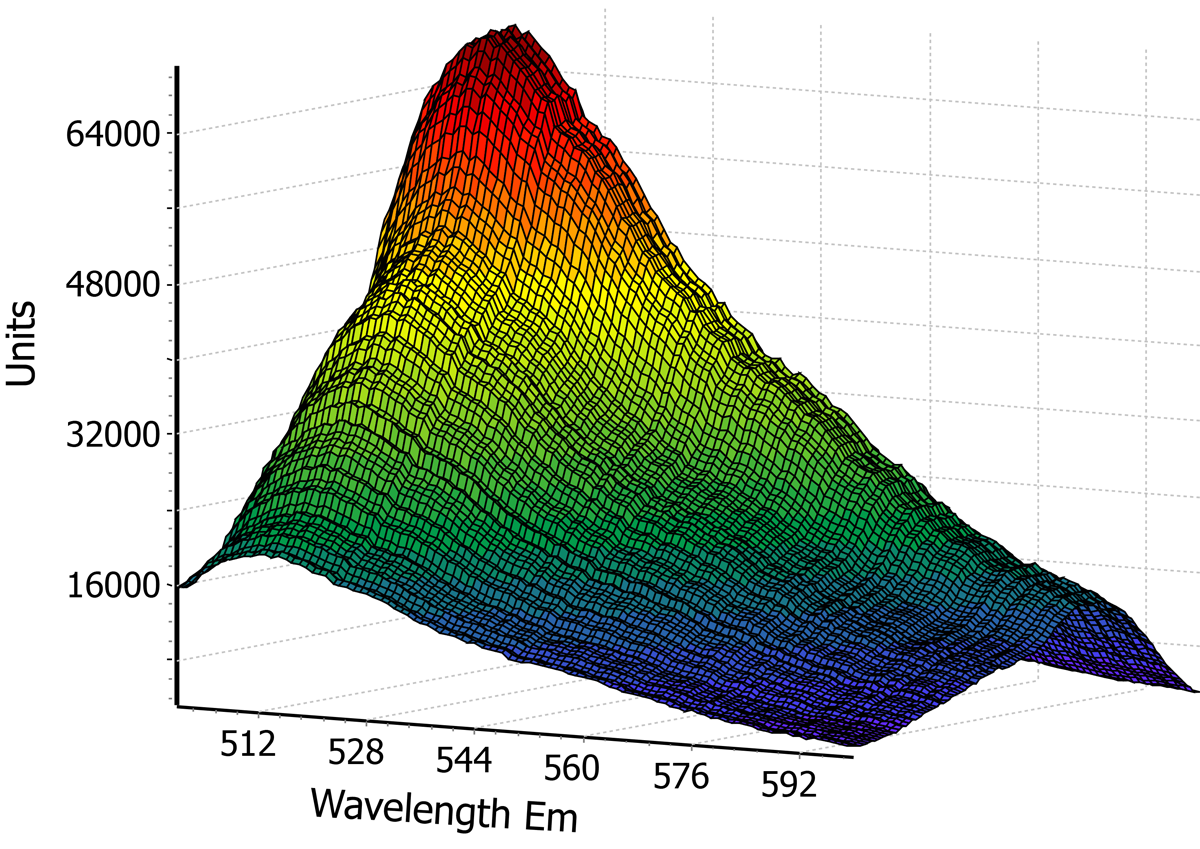
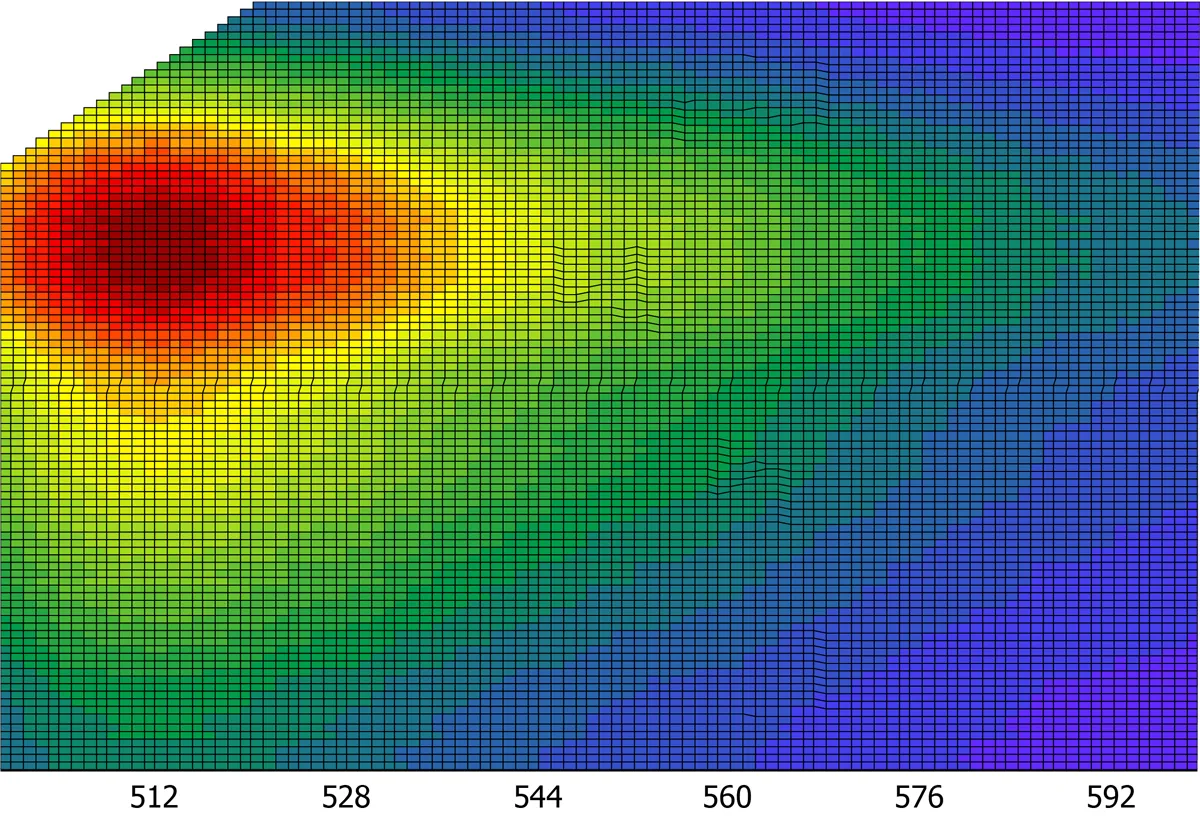
Well mapping to check for sample homogeneity
Insoluble particles like cells or aggregates typically do not evenly distribute across the well. Matrix scanning, a key feature on BMG LABTECH readers, scans a whole well creating a matrix with up to 900 points/well resolution. In MARS, the different data points can be analysed separately or as clusters. Data can also be displayed as a 3D well map. This feature can also be used to view kinetic absorbance data three dimensionally.
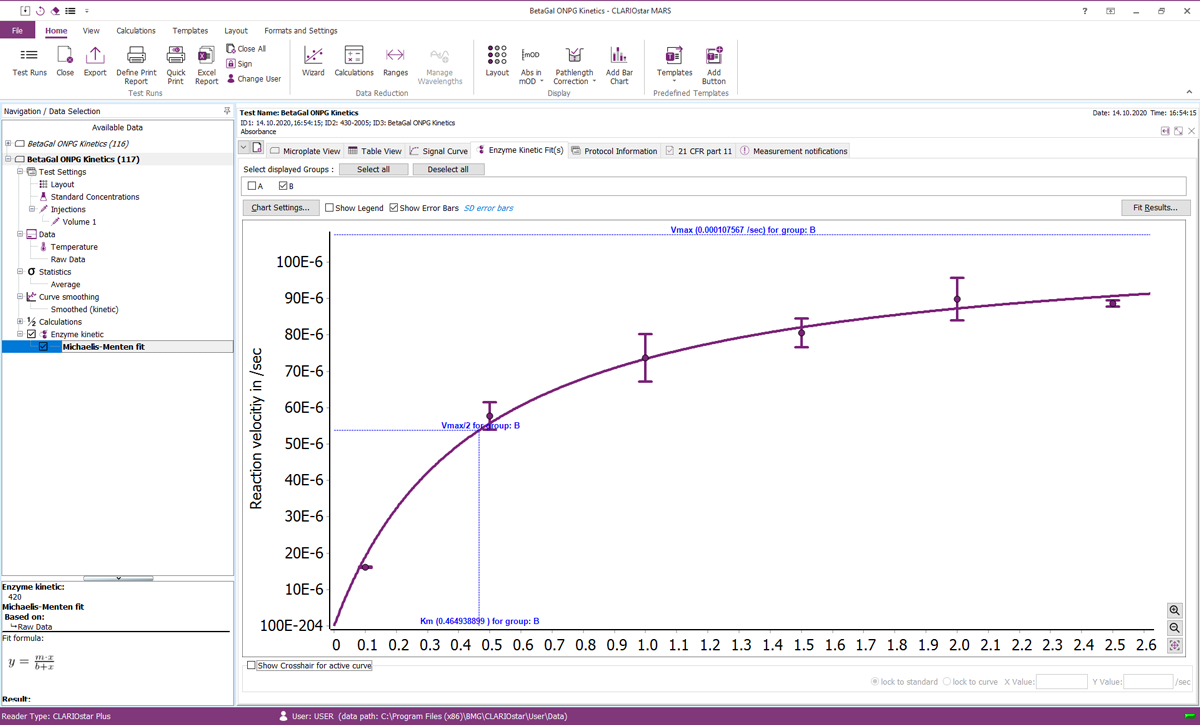
Enzymatic analysis made easy
MARS can instantly analyse enzyme activity data to determine enzymatic constants such as Km and Vmax by fitting to various models like Michaelis-Menten, Lineweaver-Burk, Eadie-Hofstee, Hanes-Woolf and Scatchard plot. This software feature, when used in conjunction with BMG LABTECH's high speed UV/vis spectrometer, will revolutionize microplate based enzyme kinetics.
Advanced fittings for binding assays
Binding kinetics as equilibrium or real-time interaction assays require advanced curve fitting capabilities and models. MARS offers various fit models including models for association, dissociation and competitive inhibition assays that are often used for compound screening of even low-affinity compounds.
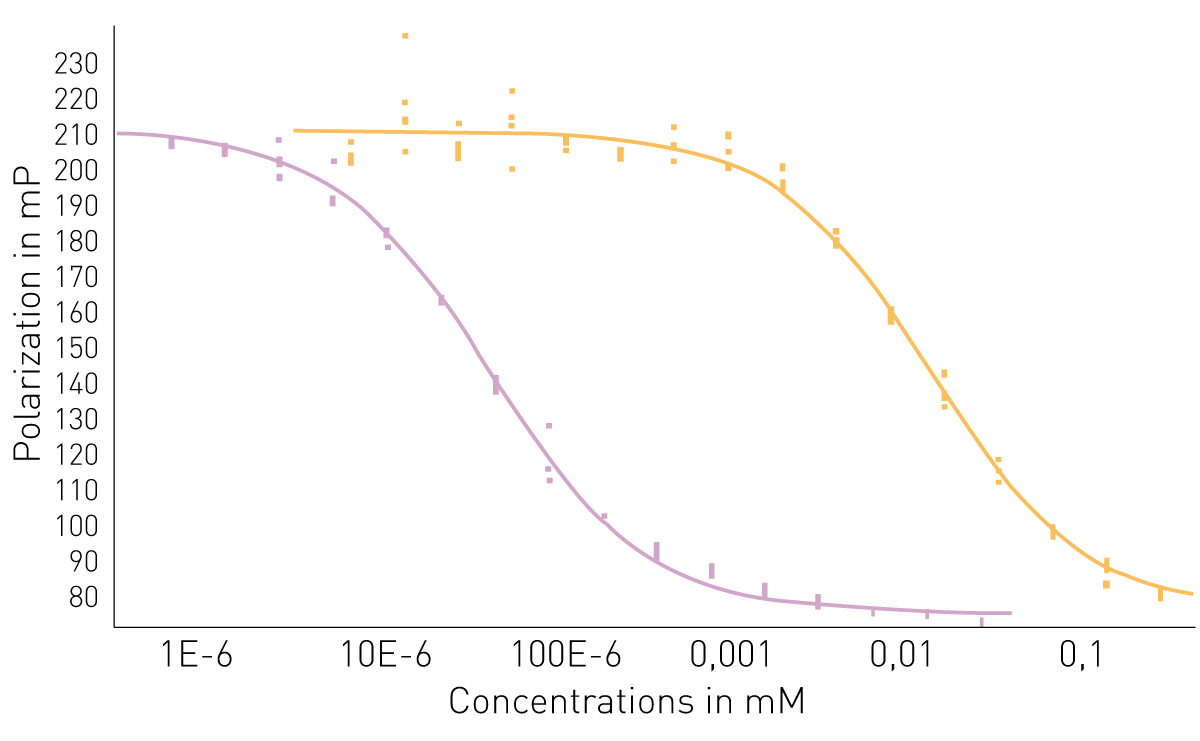
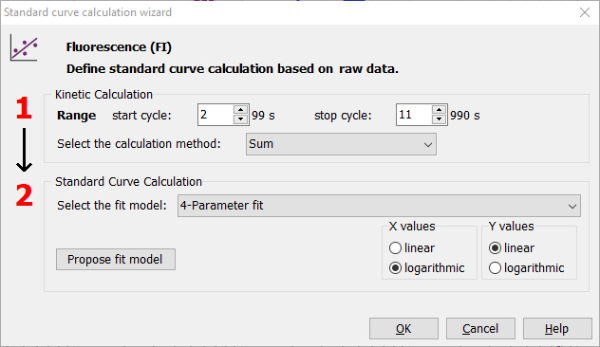
Parallel-line and dose-response curve analysis
Compare different drugs based on their EC50 / ECX values or estimate their relative potency using MARS’ ‘Parallel-line Analysis’ and ‘Standard Curve Calculation’ feature. The ‘Parallel-line Analysis’ feature offers global fitting followed by ANOVA-like analysis and equivalence testing (suggested by the US Pharmacopeia) to test for bioequivalence. MARS offers different fit models including linear, 4P- and 5P-models. Even more fit models are available with MARS’ ‘Standard Curve Calculation’ feature.
-
Current Software versions & System requirements
We constantly improve our software to provide you with more flexibility and capabilities. BMG LABTECH software upgrades are free of charge during the warranty period for the instrument. Contact us on our software support page.
Reader Control Software
Reader software Installation Version Reader Control Firmware MARS Release date PHERAstar FSX V6.20 Edition 2 V6.20 V1.33 / V2.00*1 V5.02 R3 31.07.2024 CLARIOstar Plus V6.30 Edition 2
V6.30 R2
V1.35 / V2.11*2
V5.02 R5
26.05.2025
VANTAstar V6.30 Edition 2
V6.30 R2
V1.11
V5.02 R5
26.05.2025
Omega series V6.30 V6.30 V1.53 / V2.02*3 V5.03 02.10.2025 SPECTROstar Nano V6.20 Edition 2 V6.20 V1.21 / V2.00*4 V5.02 R3 31.07.2024 NEPHELOstar Plus V5.70 Edition 7 V5.70 V1.53 V4.20 08.02.2023 CLARIOstar V6.30 Edition 2
V6.30 V2
V1.35
V5.02 R5
26.05.2025
PHERAstar V6.20 Edition 2 V6.20 V1.42 V5.02 R3 31.07.2024 PHERAstar Plus V6.20 Edition 2 V6.20 V1.42 V5.02 R3 31.07.2024 PHERAstar FS V6.20 Edition 2 V6.20 V1.33 V5.02 R3 31.07.2024 OPTIMA series V2.20 R14 V2.20 R2 V1.26 V3.01 R2 20.12.2013 NOVOstar V1.30 R9 V1.30 V1.22 V2.41 06.11.2012 NEPHELOstar V4.32 R9 V4.32 V3.07 V2.41 06.11.2012 *1 Compatible from serial number 472-2001
*2 Compatible from serial number 430-4001
*3 Compatible from serial number 415-5001
*4 Compatible from serial number 601-3001- Computer with Microsoft Windows 7 / 8 / 10 / 11 and more than 2 GHz clock rate
- 1GB or more RAM
- 2GB free hard disk memory for software installation
- Minimum screen resolution 1280 x 900 pixels
- One free USB port (One free serial communication port for older readers)
Voyager
Reader software
Installation Version
Voyager
Firmware
MARS
Release date
CLARIOstar Plus
V2605
V2605
V2.11FWP11
V5.14
21.05.2026
VANTAstar
V2605
V2605
V1.12 FWP11
V5.14
21.05.2026
* Compatible from serial number 430-4001
Item Minimum Requirements Processor x64-based processor Operating System Microsoft Windows 10 / 11 64-Bit Memory 4 GB RAM (8 GB RAM recommended) Hard Drive 2 GB (4 GB of available space or more recommended) Minimum Screen Resolution 1680 x 1050 Pixel Connection 1 free USB 2.0 / 3.0 port


Microplate reader software
BMG LABTECH provides a comprehensive software solution that facilitates the acquisition and analysis of data. Learn more about the benefits for your research.