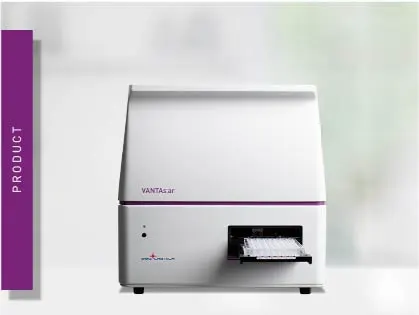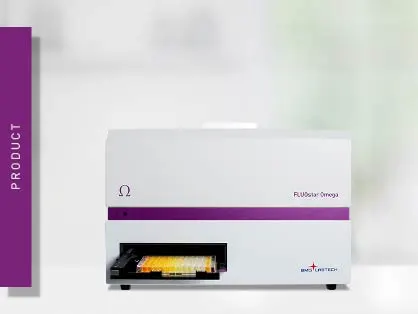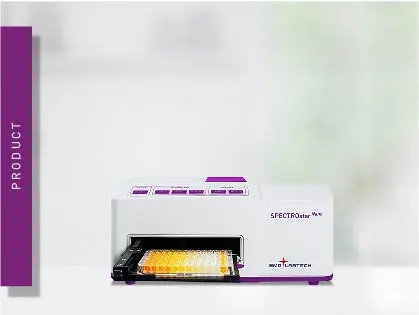

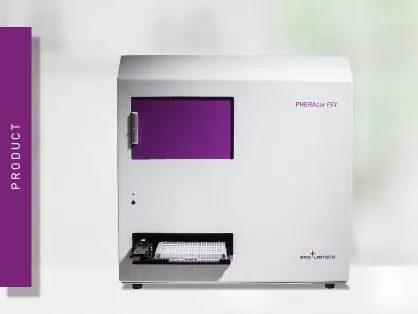
5 BMG LABTECH filters 5 BMG LABTECH filters

Understanding Absorbance & Transmittance

Absorbance measurements are essential for generating reliable results across a wide range of workflows, including ELISAs, nucleic acid quantification, protein assays, and more.

What is absorbance?

Absorbance is a measure of how much light is absorbed by a substance rather than passing through it. Transmittance is the fraction of light that passes through a substance, so higher transmittance means lower absorbance.

It is a physical process we come across every day as we see colors: White light such as sunlight contains all colors of visible light. When it shines on the green grass, the grass absorbs all colors but the green. The green light is reemitted and this is what gives the grass its color.

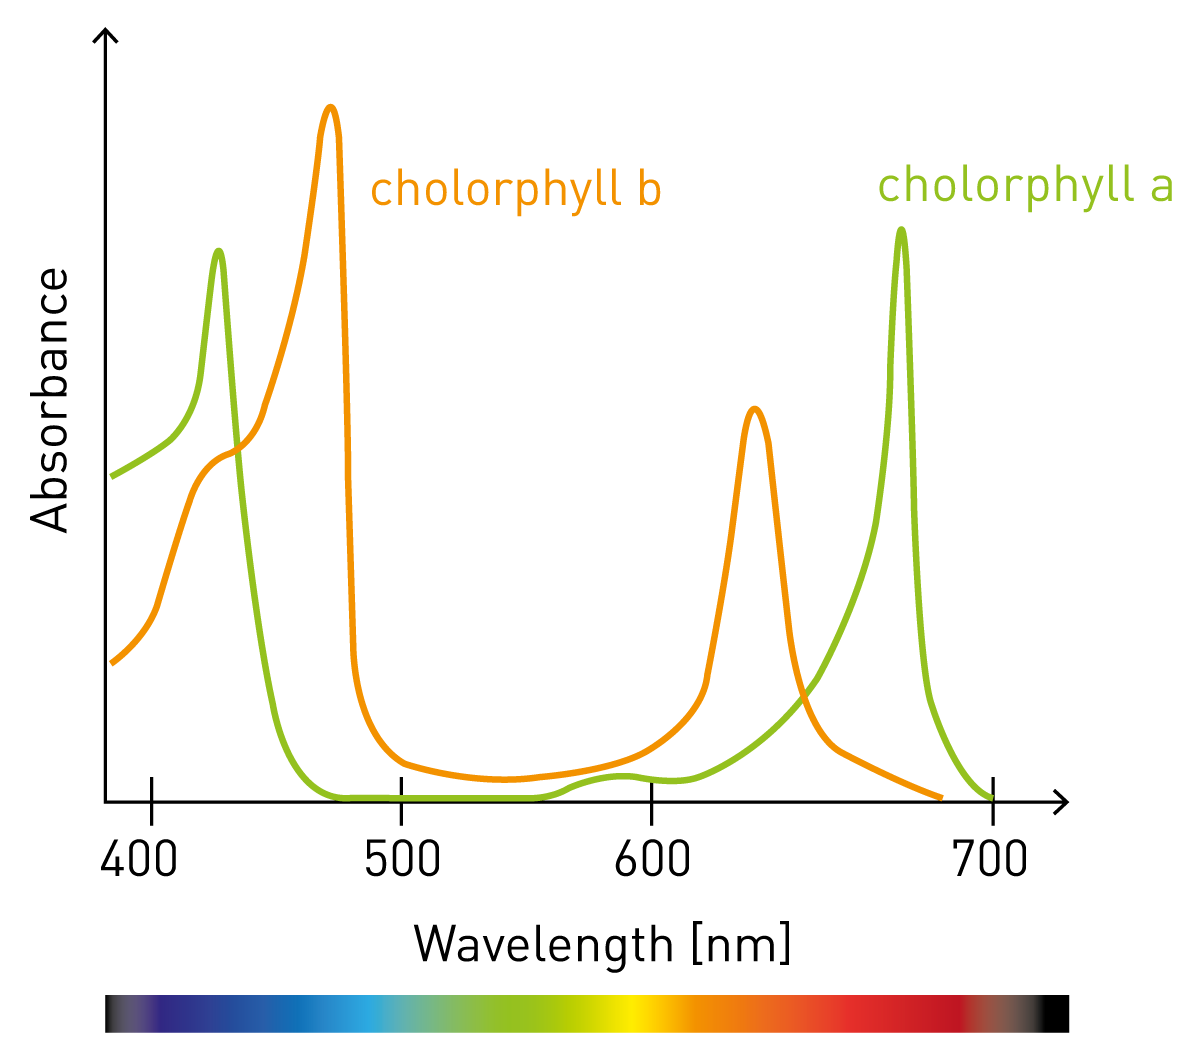
Figure 1. a) Absorbance is when light is taken up by matter. Such as grass grabs the energy of all but the green light which is reemitted.

Fig. 1: b) The color of plants is given by Chlorophyll. Its absorbance spectrum shows absorption of blue and red light, but not of the green part of light.


Why measure absorbance?

In biology and chemistry, absorbance is used to measure the concentration of molecules in solution, since many biomolecules absorb light at specific wavelengths.

For example, Nucleic acids and proteins absorb UV light, chlorophyll absorbs light of blue and orange/red and hemoglobin absorbs yellow-green light. These analytes can be quantified without further procession, at least if they are found in a solution with low background absorbance.

However, absorbance quantification is not limited to a handful of absorbing molecules. Chemical reactions assist in producing absorbing molecules for quantification dependant on a specific substrate or on an enzyme. Hence, color development (and absorbance) is more intense, the more of the compound/enzyme is found in the sample. Further below, many examples for absorbance measurements are given, from measuring cell viability to protein concentration with protein assays.

The parameters needed to measure absorbance

Light source

The measurement of light transmission / absorption requires light. Different light sources can be used for absorbance measurements differing in the spectral range they cover, their intensity and the stability of the light they emit.

Tungsten Halogen lamps cover the range from 360 nm to more than 1000 nm and are often used due to their cost-effectiveness. Xenon flashlamps, however, cover the spectral region from 220 nm to 1000 nm and cover the UV-range of the spectrum, making the detection and quantification of nucleic acids (260 nm) and proteins (280 nm) possible. BMG LABTECH absorbance microplate readers are equipped with a xenon flashlamp for absorbance measurements and hence provide maximum flexibility to measure any wavelength between 220 and 1000 nm, or all the whole spectrum of wavelengths.


Sample

Samples in liquid form need to be transferred either to a clear cuvette or to a microplate in order to measure their absorbance. Various materials are commonly used and differ from one to another. Polystyrene is most often used and may be altered to provide specific binding characteristics, either for cell culture or ELISA applications. However, they are non-transmissive in the UV-range which requires the use of special plates of cyclic olefin copolymer to measure absorbance below 400 nm. 


Sample volume

A second aspect to consider is the sample volume that is needed for reliable absorbance measurements. Standard cuvettes require approximately 4.5 ml whereas semi-micro volume cuvettes allow reducing the volume down to 1.5 ml and micro-volume cuvettes get along with 70 µl. The cuvette measurement is horizontal: light is directed from one side of the sample with the and on the opposite side the transmitted light is detected on the opposite side. Therefore, the geometry of cuvettes provides a standardized path length of 1 cm. This is one of the major differences to microplate measurements as they run vertically (top to bottom or bottom to top). Accordingly, the path length also changes with the sample volume and requires the use of equal volumes for one experiment. Additionally, meniscus effects play an important role for the path length in microplate absorbance measurements,as explained in detail in the HowTo Note: How to deal with path length and meniscus in microplates. Measurements performed in the middle of a microplate well suffer from a much shorter path in presence of a strong meniscus compared to a measurement with no meniscus. This is of specific importance when applying Beer-Lambert or when having highly variable menisci in an experiment. In aqueous solutions it is possible to correct for meniscus-dependent path length changes by exploiting the absorbance of water (water-peak path length correction).

Standard 96 well plates are typically used with sample volumes ranging between 100 - 300 µl, translating to an approximate path length if 2.9 to 7.4 mm. It might be necessary to further reduce the volume of precious sample without compromising in path length. To this end, half area plates or higher density plates may be used. They provide a smaller well area but the same height as standard 96-well plates and, thus, providing high path lengths with lower volumes.


The appropriate blank

In order to correct absorbance measurements for undesired absorbance from buffer components, from the plate or cuvette, and from light scattering effects a blank is measured in parallel to samples. The appropriate blank contains all components of the assay except from the analyte. Conversely, this means that a PBS or water blank is often insufficient.

Special attention should be paid to particles found in the analyzed samples and blanks. Particles scatter the light and increase the measured absorbance value since less light reaches the detector. As particles move in solution they are detected when they block the light path. When moving out of the detection path the will not be measured. This phenomenon increases the variability of absorbance data. If particles cannot be removed from measured solutions it is recommended to cover a bigger area of the microplate well in the absorbance measurement, a feature all BMG LABTECH devices offer for absorbance measurements.
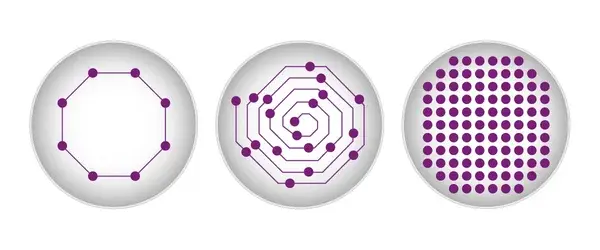
Fig. 2: Well scanning options in BMG LABTECH microplate readers reduce the variability of absorbance measurements containing particles.


Detector of absorbance measurements

After the transmitted light passes through the sample it needs to be detected. Two different types of detectors are commonly used in microplate readers: either a photomultiplier tube (PMT) or a CCD spectrometer. PMT- based systems require the selection of wavelength before the detection. This is done by optical filters or monochromators that select the desired wavelength before it is guided to the sample.

The transmitted light of the desired wavelength then reaches the PMT, which amplifies the signal from the transmitted light and results in a voltage indicative of its intensity. In order to scan absorbance over a range of wavelengths, PMT-based systems use a monochromator that selects the desired wavelength for each point in the spectrum and measures them sequentially.

This is the main difference to the second type of absorbance detectors, the spectrometer. It splits the transmitted light into different wavelengths and these are directed onto a CCD detector, capturing the intensity of all wavelengths at once. This way, spectra as well as single or few wavelength measurements can be acquired in a similar amount of time. For instance, BMG LABTECH instruments employ UV/vis Spectrometer for absorbance measurements that capture a whole spectrum (220 1000 nm) in less than a second.
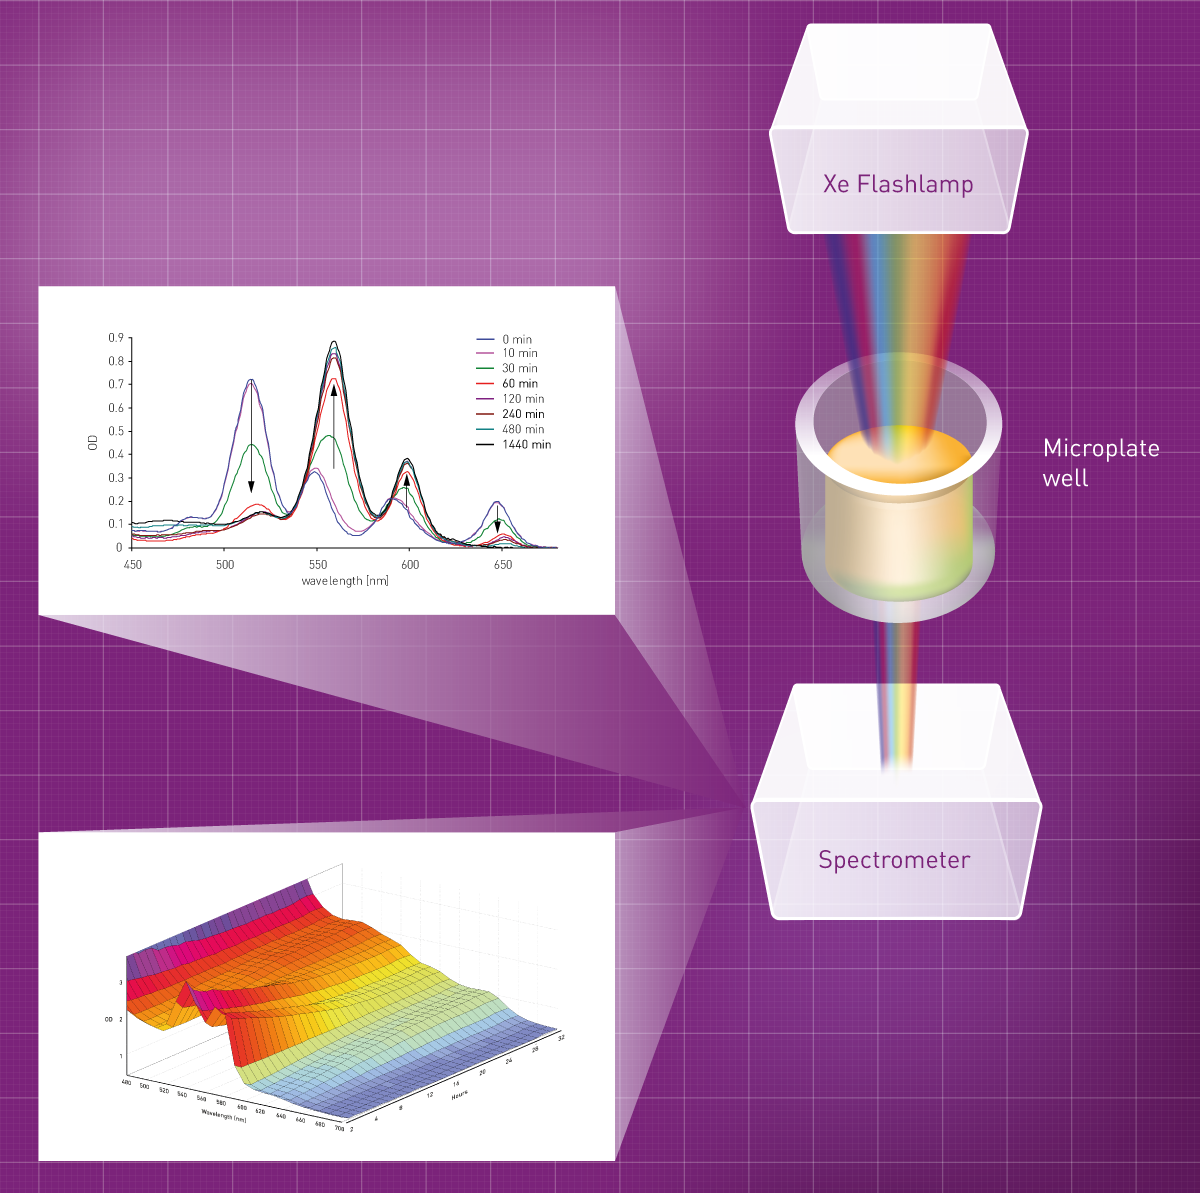
Fig. 3: A UV/vis spectrometer as absorbance detector acquires the whole absorbance spectrum (220-1000) at once.


Calculating absorbance versus transmission

Detection path in cuvettes and microplates

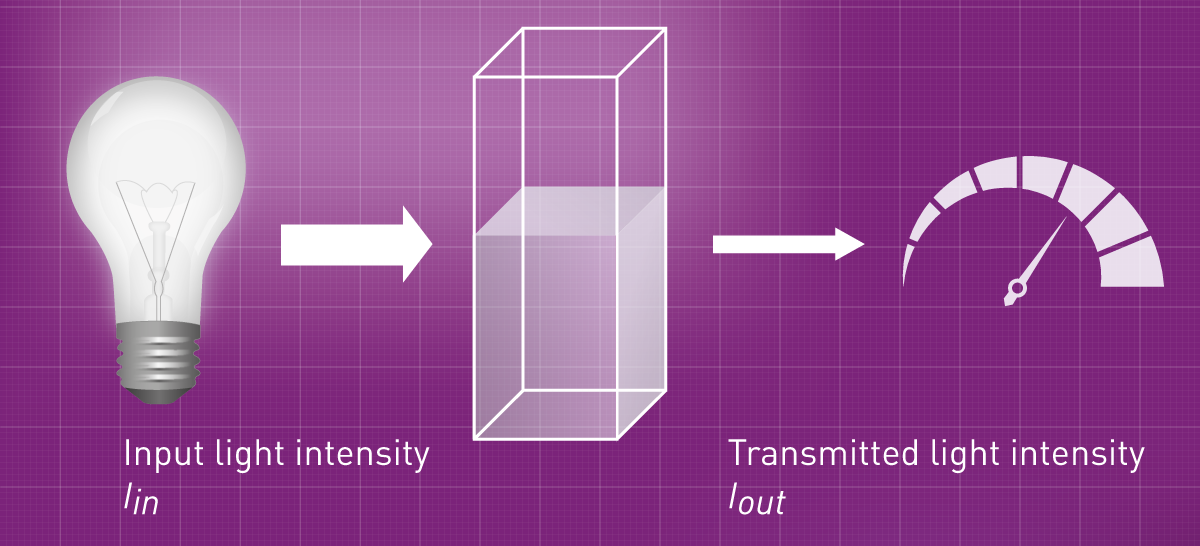
A solution containing an analyte with known absorbance characteristics is placed in the cuvette, and the reader sends light of known intensity through the sample while detecting the light that passes through it. Any light that does not reach the detector has either been absorbed or scattered. The scattered component is measured separately using appropriate blanks and subtracted to obtain the true absorbance of the analyte.
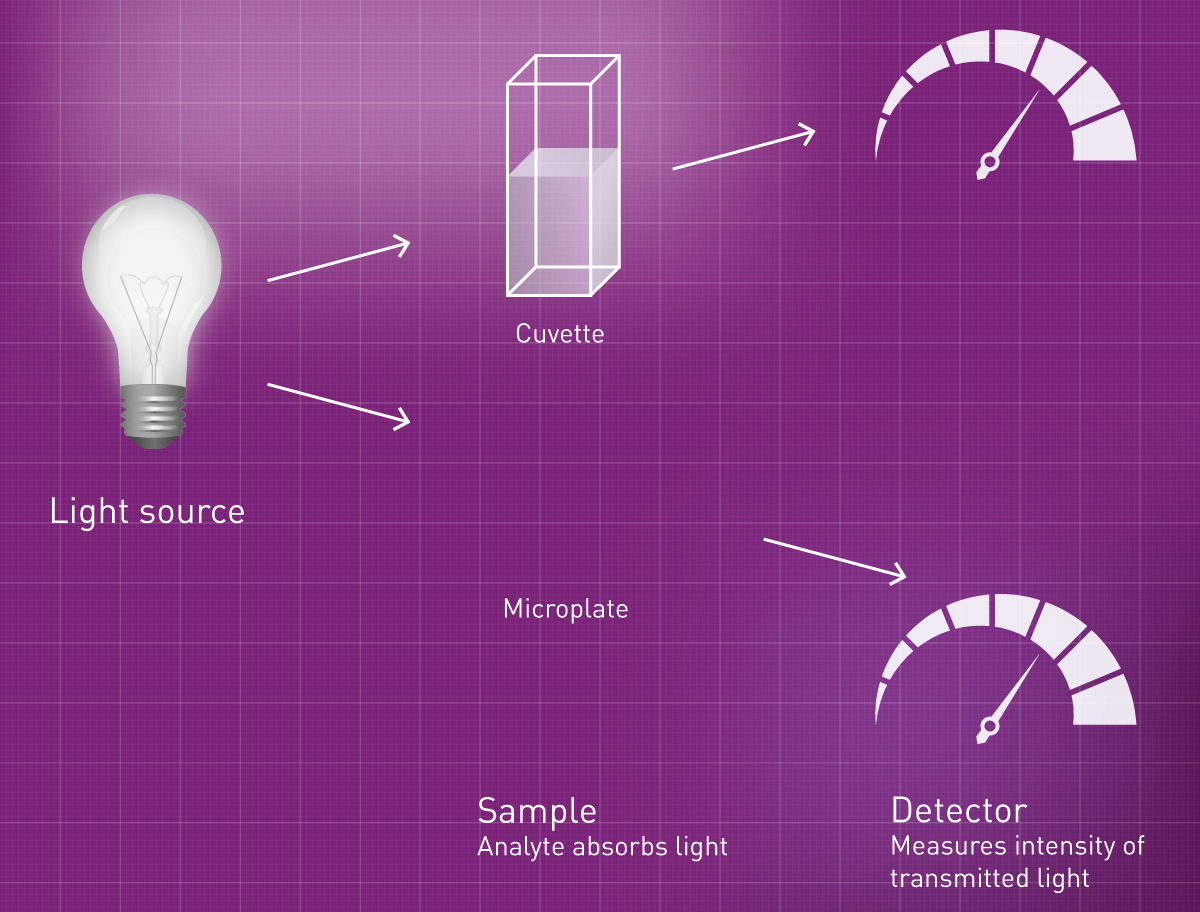
Fig. 4: Absorbance is measured by sending light through the sample and detecting the transmitted portion of it.


The portion of the light that is able to pass the sample is often given as percentage (Fig. 5). As the concentration of the analyte increases, the more light is absorbed by it and the lower is the transmission. The absorbance, however, is the part of the light that was taken up by the analyte. It is the absolute value of the logarithm (to the power of 10) of the transmission1

Fig. 5: Mathematical relation between absorbance and Transmission.


Transmission:    T = Iout / Iin 
Absorbance:    A = -log10T


Table 1: Examples for Transmission and according Absorbance values


Transmission Absorbance
0.1 (or 10%) 1 OD
0.01 (or 1%) 2 OD
0.001 (or 0.1%) 3 OD


After performing an absorbance measurement the result is a value given in either transmission or optical density. However, the goal of the measurement is the quantification of a substance in solution, the obvious question is how to convert the signal into the concentration value. Generally, there are two ways: by employing the Beer-Lambert law or by measuring a standard curve in parallel to samples of unknown concentrations.


Beer-Lambert Law

The Beer-Lambert law describes the relation of absorbance, path length and concentration of an absorbing substance:

A=c*d*ε
Changed to c:     c=A/(d*ε)

Beer-Lambert law with A – Absorbance, c – concentration, d – path length, ε – extinction coefficient.

Absorbance is linear to the concentration multiplied by the path length and extinction coefficient2. The path length refers to the length of sample the light has to go through. For instance, in a cuvette the path is standardized to 1 cm. The extinction coefficient is a constant specific for an absorbing substance and a specific wavelength, typically the absorbance maximum of the substance. It provides information on how strongly the specific substance absorbs light at the specific wavelength. As an example, the mass extinction coefficient for bovine serum albumin (BSA) is 0.67 µl*cm-1*µg-1. Accordingly, a solution of 1 µg/µl BSA with a path length of 1 cm has an absorbance of 0.67 OD.

The Beer-Lambert law is very helpful as it allows quantification of absorbing substances without the need to add any other reagents. However, it is limited as outlined below.

Beer-Lambert law can only be used if

  • Analyte absorbs light at a specific wavelengths
  • Path length is known
  • Extinction coefficient for the analyte is known
  • Absorbance of buffer reagents does not overlap with absorbance of the analyte

Using a standard curve

If any of these criteria do not apply, there is the possibility to indirectly measure analytes and/or using a standard curve. For instance, colorimetric protein quantification assays such as the Bradford assay depend on a substance that increases absorbance in presence of proteins. The increase is measured in a standard curve with known protein concentrations as well as in samples, so that their concentration can be calculated.
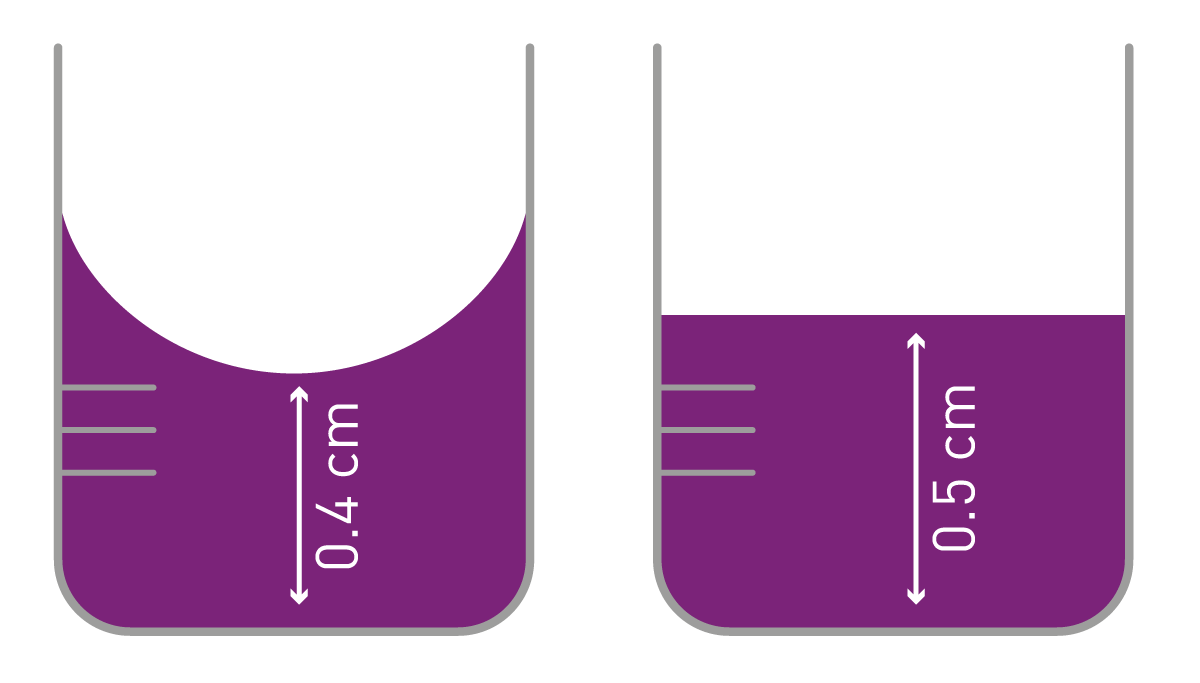
Fig. 6: The meniscus of a liquid surface changes the path length in microplate wells.


Pitfalls in absorbance measurements

Absorbance measurements are widely used to quantify substances in solution, but they are not always straightforward. Results can be affected by sample turbidity, interfering compounds, inaccurate path length, and instrument limitations, which can make it difficult to obtain a reliable signal.


Using the wrong plate

When measuring in the UV-range, as it is required for nucleic acids or NADH, it is absolutely required to use UV-transparent plates. Otherwise the absorbance measurement will result in maximum absorbance in all samples.


Comparing cuvette with microplate measurements

The path length in cuvettes is normalized to 1 cm but in microplates it changes depending on volume and plate format. Therefore, absorbance acquired in microplates is typically lower than the absorbance of the same solution measured in cuvettes. If aqueous solutions are measured the microplate measurement can be normalized to 1 cm by using the water-peak path length correction. Determination of the path length further allows to calculate analyte concentrations with Beer-Lambert law.


Using different volumes

For measurements in a microplate itis recommended to always use the same volume to generate the same path length for all samples. However, in samples with a meniscus, the path length may be different despite using the same volume. Again, for aqueous solutions the water-peak path length correction can be used to overcome the problem or to determine the path length for Beer-Lambert calculations.


Disturbance of the light path

Anything which is in the light path will increase the measured absorbance. Often these are air bubbles in the sample, condensation on a lid, dust, scratches or fingerprints on the bottom of the plate. Hence, checking the plate just before measurement is recommended.

What is typically measured by absorbance?

Absorbance is commonly used in applications that measure the concentration of specific substances in solution. It is particularly valuable in assays for proteins, nucleic acids, pigments, and other analytes that either absorb light directly or generate a measurable color change.


Protein quantification

Many absorbance measurements aim at determining the concentration of proteins in solution. Several colorimetric methods are available to measure the whole protein content of a sample. This is required to normalize protein samples before downstream applications such as western blots or immunoprecipitations. In our blog article “Protein measurement: find a suitable method” you will find detailed descriptions of Bradford, BCA and other methods and tips to help you choose.


Nucleic quantification

Nucleic acids and their components show natural absorbance at 260 nm. Without the need of any sample preparation or staining procedure absorbance measurements at this wavelength can be exploited to determine DNA/RNA concentration fast and easy. By taking additional measurements at other wavelengths such as 230 nm, 280 nm or 340 nm, nucleic acid purity can be evaluated on top.


ELISAs

Using absorbance, it is as well possible to quantify a specific protein in solution. A popular method is the enzyme-linked immunosorbent assay (ELISA). In brief, an antibody immobilized in the microplate well binds specifically to the protein of interest and captures it in the plate. A second antibody that is likewise specific for the protein of interest binds to the captured protein and can be recognized by secondary enzyme-bearing antibodies. Accordingly, the more protein of interest is present in the sample, the more enzymes will be bound in the microplate well. A substrate converted by the enzyme to a chromophore can finally be measured by absorbance and report on the amount of the specific protein present in the sample3.


Cell viability

Colorimetric assays that report on cell health are popular as they are quick and cost effective. When employing a microplate, many conditions can be tested at once. Absorbance-based methods mainly rely on the capability of metabolically active cells to reduce substrates such as MTT or Resazurin. Their reduced forms display absorbance at specific wavelengths and thus report on the metabolic activity of a cell sample, a characteristic often affected by cell viability4. Our cell viability blog post describes in detail colorimetric and other methods to measure cell health.


Microbial growth

The absorbance read mode of microplate readers and photometers determines the multiplication of bacteria and yeast by measuring the “optical density at 600 nm” (OD600). Strictly speaking, it is light scattering5 and not absorbance that is being measured in this measurement mode for this application. The particles (bacteria or yeast) in microbial suspensions scatter light: the more microbes are present in solution, the more light is scattered. This also means less light reaches the detector and the measured transmission is lower. In this way, higher absorption is calculated for increased numbers of microbes, although this change is caused solely by an increase in light scattering instead of specific absorbance at 600 nm.


Frequently asked questions

  • What are common applications of absorbance measurements?

    Common applications for absorbance measurements include enzyme-linked immunosorbent assays (ELISA), protein quantification assays (Bradford, Lowry assays, bicinchoninic acid assays), nucleic acid analysis, and cell viability tests.
  • What is absorbance in spectrophotometry?

    Absorbance is a measure of how much light a sample absorbs at a specific wavelength. It’s calculated from how much light is transmitted versus how much passes through.
  • What is the Beer-Lambert Law?

    The Beer-Lambert Law relates absorbance (A) to concentration (c), path length (l), and molar absorptivity (ε): A = εcl.
  • How is absorbance different from transmittance?

    Absorbance is a logarithmic measure of the fraction of light absorbed; transmittance (T) is the fraction of light that passes through. They are related by the equation A = -log10(T).
  • What units are used for absorbance?

    Absorbance (A) is unitless. Some related quantities like concentration use molarity (M) and path length is measured in centimeters or millimeters.
  • What affects absorbance measurements besides the sample?

    Path length, cuvette quality, light source stability, detector sensitivity, stray light, and temperature can all affect absorbance.
  • Why is path length important for absorbance measurements?

    Absorbance is proportional to path length (l). Longer path lengths yield higher absorbance for the same concentration, affecting accuracy and linearity.
  • What is the dynamic range in absorbance measurements?

    The dynamic range is the concentration or absorbance range where the microplate reader provides accurate, linear responses (often A ~ 0.1 to 2.0 for many systems; higher can be nonlinear).
  • What does a microplate reader offer for absorbance measurements?

    A microplate reader significantly reduces the time needed for absorbance measurements and increases throughput compared to traditional single-sample methods.

References

  1. IUPAC, Compendium of Chemical Terminology, 2nd ed. (the "Gold Book") (1997). Online corrected version:  (2008) "Absorbance". doi:10.1351/goldbook.A00028
  2. IUPAC, Compendium of Chemical Terminology, 2nd ed. (the "Gold Book") (1997). Online corrected version: (2014) "Beer–Lambert law (or Beer–Lambert–Bouguer law)". doi:10.1351/goldbook.B00626
  3. Crowther, J.R. (1995). Chapter 2: Basic Principles of ELISA. ELISA: Theory and Practice. Humana Press. pp. 35–62. ISBN 0896032795.
  4. Riss, T. L. (2013) Cell Viability Assays. Assay Guidance Manual. Bethesda (MD): Eli Lilly & Company and the National Center for Advancing Translational Sciences. https://www.ncbi.nlm.nih.gov/books/NBK144065/
  5. Keiran Stevenson et al. (2016) General calibration of microbial growth in microplate readers. Scientific Reports volume 6, Article number: 38828 (2016) https://doi.org/10.1038/srep38828
Newsletter Sign-up