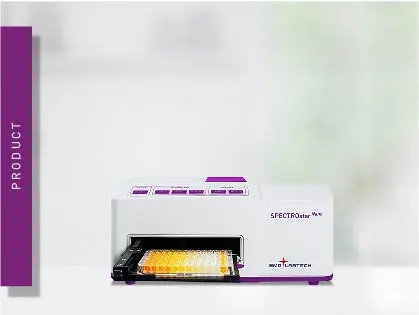
SPECTROstar Nano
Absorbance plate reader with cuvette port


This author profile refers to work created by Dr Andrea Krumm during her tenure at BMG LABTECH - the Microplate Reader Company, where she served as an Applications Specialist contributing scientific content, application notes, and technical expertise. Dr Krumm is no longer employed at BMG LABTECH, but her published materials remain available here for reference and archival purposes. Dr Andrea Krumm is a biotechnology specialist and product manager known for her work in analytical instrumentation and biopharmaceutical analysis. She studied biotechnology and later earned a PhD in cancer biology, focusing on topics such as DNA repair, epigenetics, and tumor biology. After completing her doctorate, she spent several years as an Applications Specialist at BMG LABTECH, where she authored application notes, conducted workshops, and supported scientific customers. In 2020, Dr Krumm joined Tosoh Bioscience GmbH as Product Manager for Analytical Columns.
As exact protein concentrations are oftentimes the basis for the success of an experiment, it is worth to dig a little deeper into the background of these assays which potentially saves time and work to get to reliable results. The following lines of this article summarize colorimetric and fluorescent protein measurements and hopefully help to decide for an appropriate assay to determine the content of your protein samples.
Just as various as the methods to measure protein concentration are the reasons why proteins need to be quantified in a life science laboratory. Proteins are measured to normalize different protein samples for subsequent applications. The samples contain a mixture of proteins and are lysates of cultured cells, cell compartments or tissues. Based on the protein measurement, they are adjusted to a consistent protein concentration and compared by methods such as western blotting or immunoprecipitations. Quantification of proteins becomes also necessary when the yield of a protein purification or biotechnological protein production step is determined. In either case, one typically has multiple samples to analyze which led to the establishment of microplate-based protein measurement assays that enable larger sample sizes, lower assay volumes and higher throughput as compared to their cuvette counterparts.
Numerous assays are available that quantify the protein content of a sample. They differ in their sensitivity, in their assay principle and in the way of detection. Below you can find the most common protein measurement assays explained and sorted by their way of detection.
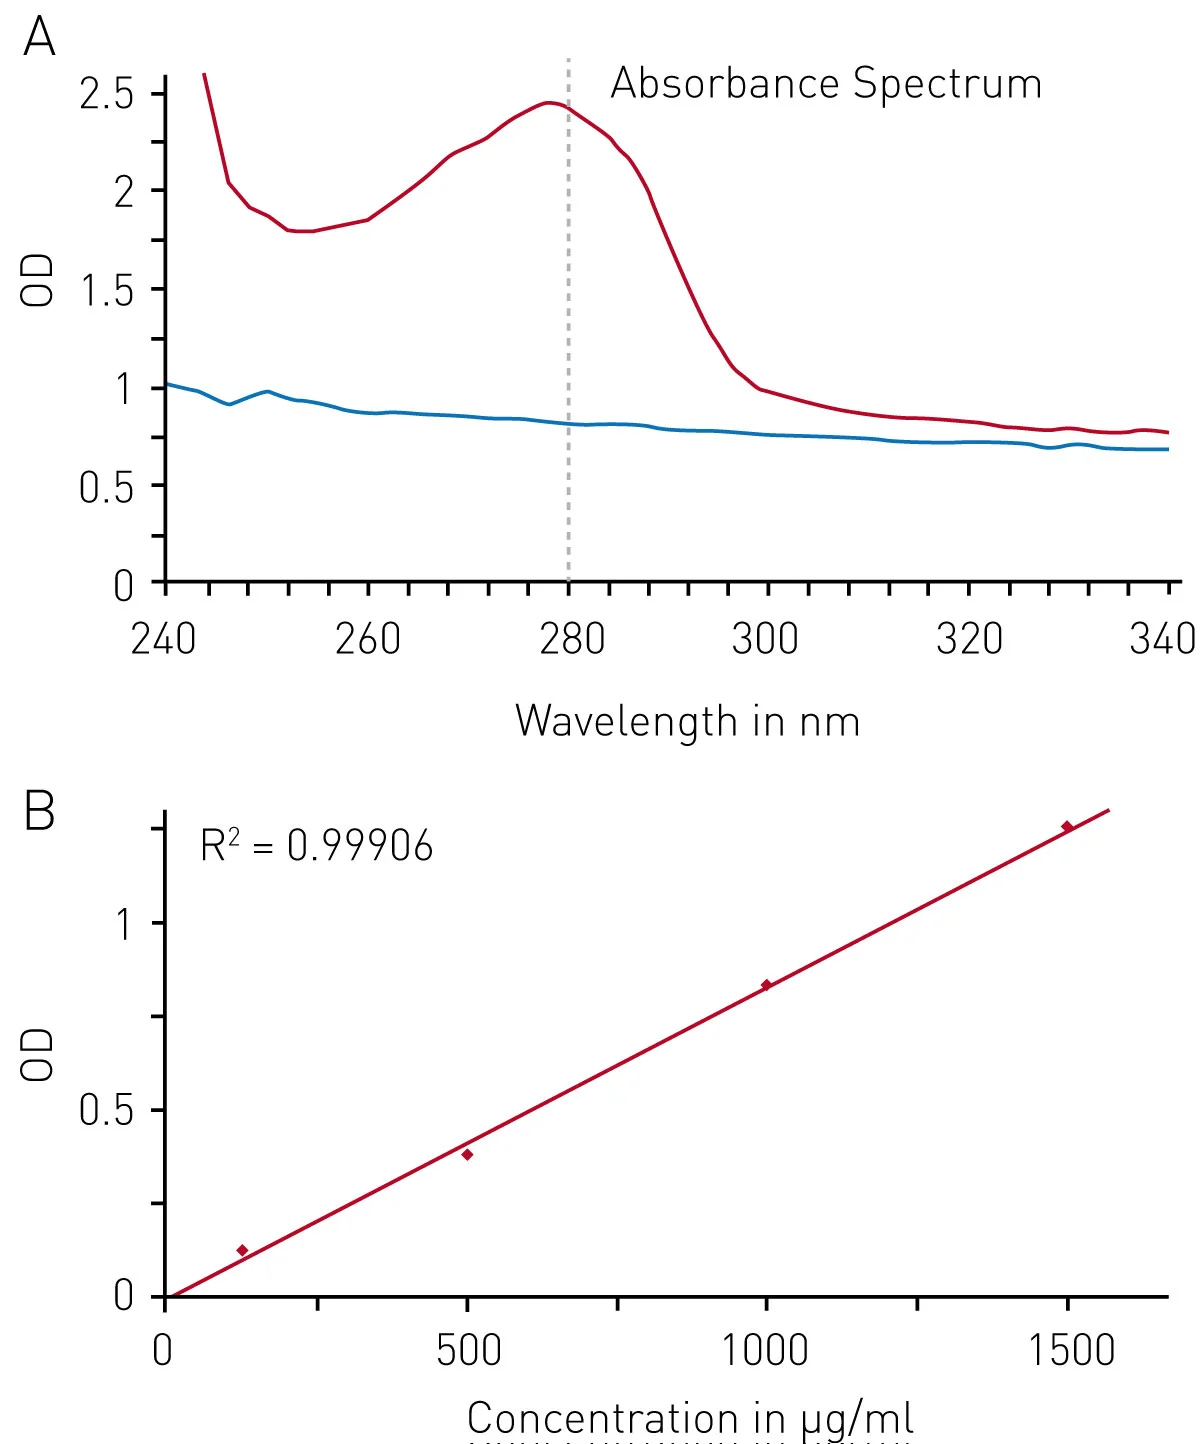
Direct absorbance measurement at 280 nm
A direct method of measuring protein is to determine the absorbance of a sample at 280 nm. Aromatic amino acid residues such as Tryptophan and Tyrosine absorb UV-light at 280 nm which allows recalculation of the protein content. Due to the high absorbance of the mentioned amino acids, no further reagents need to be added to the sample, making it possible to reuse the extract after the quantification based on the present amino acids. However, the method requires the exact extinction coefficient for the protein or protein mixture quantified. The extinction coefficient depends on the amount of aromatic residues of the included amino acids and is indispensable to calculate the protein concentration from the absorbance value. The A280 method isa protein assay especially suited for highly concentrated samples. Get more information in our topic-related application note AN299: Absorbance-based methods for protein quantification on BMG LABTECH instruments.
Colorimetric protein measurement: Bradford
Besides the protein quantitation based on the absorbance of the present amino acids in a protein, there are also colorimetric option to determine the protein levels. The Bradford protein quantification assay relies on the association of Coomassie-Brilliant Blue R-250 with proteins and the accompanying shift in absorbance from 470 nm to 595 nm. For the protein measurement, the protein-containing sample is mixed with the Bradford reagent and after 5 min the absorbance at 595 nm is recorded. Parallel to unknown samples, a standard curve with defined amounts of protein is measured as a reference for the protein assay which establishes the basis to calculate the concentration of your unknowns.Colorimetric protein measurement: BCA (bicinchoninic acid assay)
The BCA assay employs the capability of peptide bonds found in proteins to reduce Cu (II) to Cu+. The copper ion is in turn quantified by BCA which chelates Cu+ and then absorbs light at 562 nm. The BCA assay requires parallel acquisition of a standard curve as well for the protein quantitation.
Colorimetric protein measurement: Lowry assay
Just as the aforementioned BCA assay, the Lowry protein measurement method measures on the reduction capability of proteins. Again Cu (II) sulfate is reduced to Cu+ which is made visible by Folin-Ciocalteu reagent resulting in a blue complex that can be quantified by its absorbance between 500 and 800 nm. Just like for Bradford and BCA assay, a standard curve is measured in parallel and is the basis for calculating the sample protein concentration in this method.
Fluorescent protein measurements
The NanoOrange® protein quantification assay employs a merocyanine dye that drastically increases fluorescence in the presence of detergent-coated proteins. Fluorescent methods generally show a higher sensitivity compared to colourimetric attempts for the determination of the protein content. It can be excited by light around in the blue spectrum (485 nm) and emits in the presence of protein in the yellow/orange spectrum of light, which is reflected in the name of this protein measurement assay. The calculation of protein concentration is again based on the measurement of a protein standard curve.
The fluorescent protein measurement kits Quant iT® Protein and Qubit® Protein work very similar as compared to NanoOrange® (all ThermoFisher Scientific). The Qubit® Protein Assay kit, however, gets along with three standards only for protein quantitation. The measurement as well as the content analysis is performed with a handheld device that detects fluorescence directly in a reaction tube. The fluorescent nature of the Qubit® assay, however, suggests its transfer to the microplate format.
Overview of protein measurement methods
| Assay | Compatible with detergents? | Concentration range | Comments |
| A280 nm | No | 50 – 2000 mg/ml. | High variation Depends on a composition of amino acids of the protein Exact extinction coefficients required Quick |
| Bradford (Coomassie) | Up to 0.1 % in the sample | *125 - 1500 µg/ml | Depends on a composition of amino acids of the protein Quick |
| BCA (Bicinchoninic Acid) | Yes | *20 – 2000 µg/ml. | Depends on a composition of amino acids of the protein Quick |
| Lowry | No | *1 – 1500 µg/ml | Not dependent on composition of amino acids Time-consuming |
| NanoOrange | Limited | *10 ng/ml – 10 µg/ml | |
| Qubit Protein Assay | No | *12.5 µg/ml – 5 mg/ml | Sequential measurements in reaction tube with handheld device |
*concentration ranges are taken from data sheets of commercial suppliers
Depending on the detection modes required, the presented protein measurements can be performed on the SPECTROstar Nano, Omega Series of readers, VANTAstar®, CLARIOstar Plus and PHERAstar FSX. Besides protein quantification methods, microplate readers can also be employed for other protein assays, e.g. to study protein function or protein interaction. Read our blog post on protein assays for an overview of the methods available.
Nano Orange is a registered trademark of ThermoFisher Scientific
Absorbance plate reader with cuvette port
Powerful and most sensitive HTS plate reader
Most flexible Plate Reader for Assay Development
Upgradeable single and multi-mode microplate reader series
Flexible microplate reader with simplified workflows
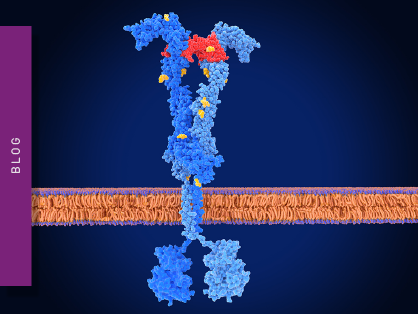
Binding constants quantify the strength of a binding reaction between a biomolecule and its target (ligand). But how do you measure them and what can you do with them?
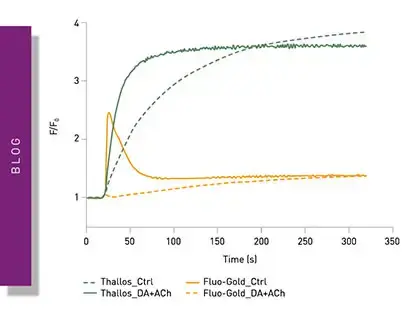
Receptor-ligand kinetics is the study of the rates at which receptors and ligands interact, bind and dissociate. Learn why these types of measurements are important and how to measure them.
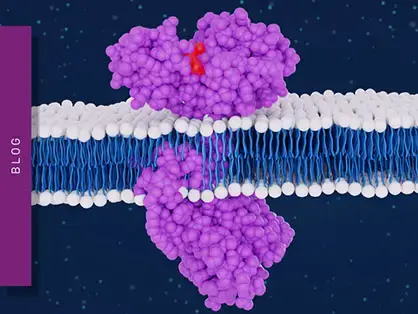
Receptor-ligand interactions are crucial for cell signalling. They are also important for drug discovery. How do microplate readers deliver benefits to both?
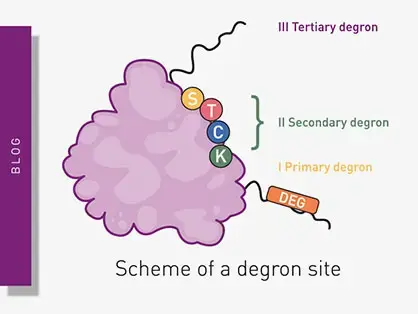
Degrons are specific sequences of amino acids or structural motifs within a protein that are important for targeted protein degradation. Find out how microplate readers can advance research into natural and engineered degrons.
Nitration can significantly modify the structure and function of proteins in cells. But how can measurements of protein nitration reveal crucial information about biological activity and how can microplate readers help?
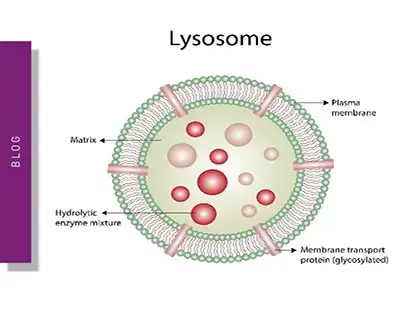
Innovation for targeted protein degradation and next-generation degraders is gathering pace. This blog introduces some of the different approaches that act via the lysosome or proteasome.