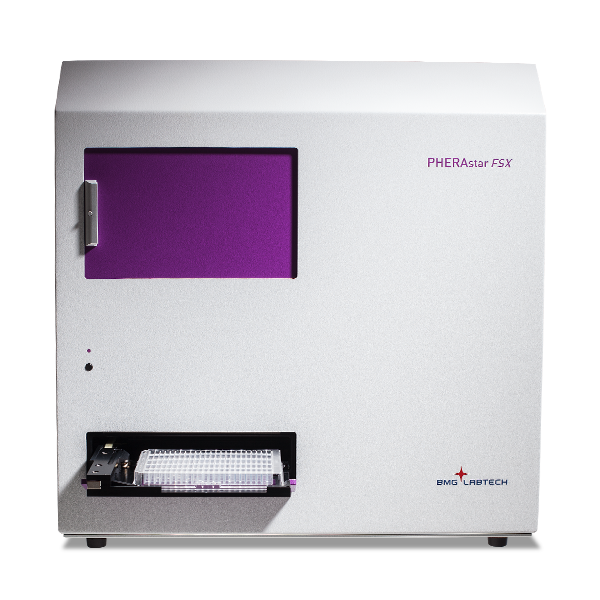
PHERAstar FSX
Powerful and most sensitive HTS plate reader


Barry Whyte is Application Scientist and Science Writer at BMG LABTECH in the United States. He has PhD and Bachelor of Science (BSc) degrees in biochemistry from the University of Bristol in the United Kingdom and more than 20 years of experience in the life sciences and science communications. Over the years, Barry has worked on three continents and traveled widely. He enjoys building on his international work experience and learning new ways to help scientists advance their research.
This blog is about binding constants (association, dissociation or equilibrium constants), how to measure them, and the crucial role they play in understanding molecular interactions. By definition, a binding constant quantifies the strength of the interaction between two molecules, such as a ligand and its binding partner, under equilibrium conditions.
Information on binding constants is important for understanding diverse areas of research where a ligand interacts with a biomolecule including cellular signaling in cell biology as well as drug discovery.1-4 Many biological processes are driven by interactions that involve binding between molecules. Receptor-ligand binding, enzymatic reactions, protein-protein interactions and DNA replication are just a few examples that inevitably depend on the proximity of two binding partners and their binding affinity to each other. The study of binding constants helps elucidate the quantitative principles underlying many molecular interactions in biology, biochemistry and pharmacology and has widespread applications.
In this blog, we not only look at binding constants but also highlight the distinction between binding affinity parameters measured at equilibrium related to the strength of interactions (KD, KA) versus investigations for kinetic rate parameters (kon, koff, residence time) which help study the duration of an interaction of a ligand for its target. While binding constants are defined at equilibrium, they are distinct from but mathematically related to kinetic rate constants (see also binding kinetics).
A binding constant quantifies the strength of an interaction between a biomolecule and its target (or ligand). Binding often occurs via non-covalent interactions such as electrostatic interactions, hydrogen bonding, hydrophobic and Van der Waals forces. These interactions can occur between many different types of molecules including proteins, nucleic acids, second messengers or hormones. When a ligand binds to a protein, it forms a complex through these non-covalent interactions, and the strength of this binding is characterized by the binding constant.
Drugs are often specifically designed to target the binding interactions associated with these molecules and specific diseases. In drug discovery and development, the determination of binding constants is therefore important data to have for the development of new drugs and treatments.5,6
The binding constant represents the equilibrium between the bound and unbound states and indicates the tendency of a complex to dissociate in solution. A low dissociation constant means the ligand is tightly bound to its target, reflecting high affinity, while a higher constant indicates weaker binding. The dissociation process occurs when the complex dissociates, causing the molecules to separate into their smaller components. These interactions and dissociation events typically take place in solution, where factors like pH and concentration can influence the equilibrium. Significant differences in binding constants exist between different molecules or interactions, which is critical for understanding drug specificity and efficacy.
Affinity is measured and reported using the equilibrium dissociation constant (KD), which refers to the concentration of a ligand at equilibrium when half its binding sites are occupied. For these measurements, the ligand should be present at a concentration in excess of the target. The dissociation constant for this type of process is denoted as KD.
Let us consider an example. For a simple binding interaction where R is a receptor (protein), L is the ligand, and RL is the complex, the reaction can be expressed as follows:
R + L ⇌ RL
where the rate of binding will be equal to the rate of unbinding when the reaction is at equilibrium. At equilibrium, the amount of bound ligand is measured to determine the binding constant. The dissociation constant for this interaction is defined as follows:
KD = [R] [L]/[RL]
Here, KD represents the ligand concentration at which half of the binding sites are occupied, reflecting the binding affinity at equilibrium.
The smaller the KD value (units M, nM or concentration), the greater the binding affinity (Fig.1).2
For the same interaction, the association constant KA is defined as follows (units inverse of concentration M-1):
KA = [RL]/[R][L]
In this case, the smaller the KA value, the weaker the binding. KA and KD are therefore related to each other as follows:
KA = 1/ KD
KA and KD do not measure different phenomena but quantify the same binding affinity in a reciprocal form and with different units. Scientists often prefer KD values because they directly correspond to concentration and are easier to interpret experimentally.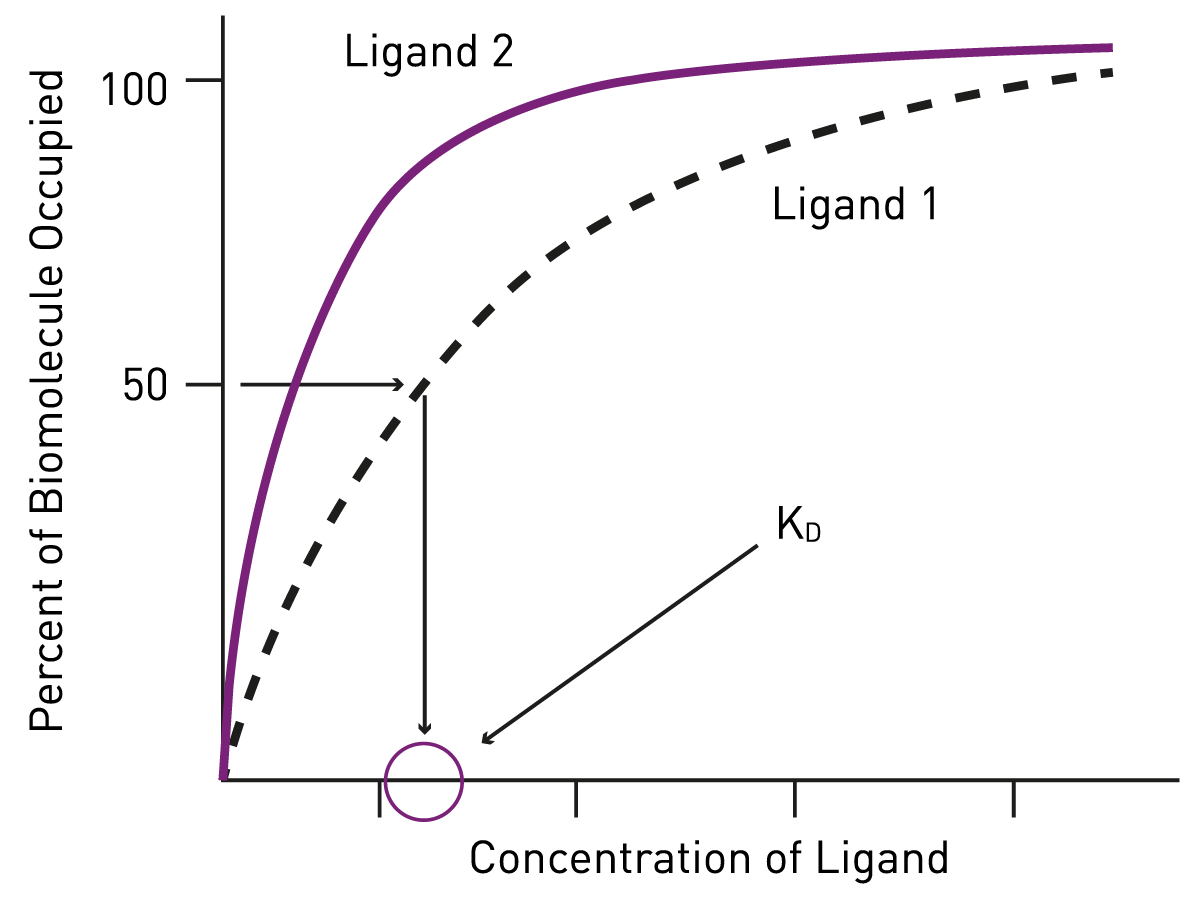
The association phase of an interaction refers to the period when the ligand binds to the target and is typically monitored in real-time kinetic studies. During these investigations, binding events between the two molecules are measured to analyze the kinetics and determine parameters such as the association and dissociation rate constants.
As mentioned in the introduction, binding affinities are not to be confused with kinetic parameters like the association rate constant (kon) or the dissociation rate constant (koff). These kinetic parameters quantify the duration a ligand interacts with its target.
The binding affinity of a drug for its target depends on the speed of binding (kon) and dissociation (koff) and on its occupation or residence time. For a binding reaction involving two molecules, such as a receptor and a ligand, we can write as follows:
kon
R + L → RL
where the association rate constant in this equation is defined through the rate law as:
Rate of complex formation = kon[R] [L]
The units of kon are M-1 s-1.
The binding affinity we defined earlier depends on both association and dissociation. Therefore, the equilibrium association constant (binding affinity) is defined in terms of association rate and dissociation rate constants as follows:
KA = kon/ koff = [RL]/[R][L]
Like its association rate constant (kon), the dissociation rate constant (koff) is a kinetic parameter not to be confused with the equilibrium dissociation constant KD. For the reaction:
koff
RL → R + L
The dissociation rate constant (koff) describes the rate at which a complex decays back into its components. In this case, after dissociation, the receptor exists as an unbound receptor, and the ligand is present as free drug in solution. The dissociation rate constant is therefore defined as:
KD = koff/ kon = [R][L]/[RL]
Scientists have a range of detection technologies available to study binding constants, including radioligand assays, affinity chromatography, surface plasmon resonance, isothermal titration calorimetry, and optical methods such as fluorescence- or luminescence-based assays for cell-based or biochemical receptor assays. A more detailed introduction on how kinetic binding studies contribute to the pharmacology of drugs across the drug discovery pipeline is available in a video of the scientific talk Kinetics in Drug Discovery by Martin Redhead.

Precise measurements of binding constants require careful control of experimental conditions, as accurate measurements are essential for reliable and reproducible results. Binding constants can change with conditions such as temperature, pH, and salt concentration, affecting the strength of intermolecular interactions. For example, temperature affects the affinity and dissociation constant of molecular interactions, and the rate of any reaction is determined by the Arrhenius equation, which includes temperature as a major factor. The presence of a catalyst can influence the rate of reactions, thereby affecting binding affinity and dissociation rates. High concentrations of other macromolecules can affect ligand-protein affinities due to macromolecular crowding. Binding constants can vary greatly between different molecules and types of interactions, so it is important to consider these factors when designing experiments.
Microplate readers can detect absorbance, fluorescence intensity, fluorescence polarization, Förster´s Resonance Energy Transfer (FRET), time-resolved fluorescence, TR-FRET, AlphaScreen® and luminescence including BRET and NanoBRET (Note AlphaScreen® and AlphaLISA® reactions are designed for single measurement events. They have considerable utility in drug discovery but are not used for kinetic binding studies). These microplate readers produce robust and reproducible results and they can be readily integrated into automated systems. They allow use of smaller sample volumes (assay miniaturisation), enable high-throughput screens, reduce evaluation times and allow multiple conditions to be tested in one test run (multiplexing).
Here we consider a few examples of application notes where binding affinities have been determined using different methods on a microplate and different detection technologies.
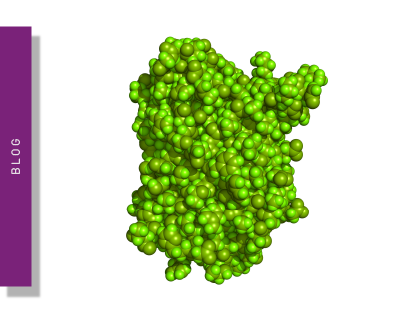
Molecular glues are small molecules that facilitate the interactions of targeted proteins with the degradation machinery of the cell. They represent a specific type of targeted protein degraders that do not have linker molecules like those found in PROteolysis TArgeting Chimeras (PROTACs). They thus are typically lower molecular weight molecules compared with other types of targeted protein degraders and may engage their target molecules with uniquely defined mechanisms.
In the application note Studying intramolecular bivalent glues using TR-FRET binding assays, TR-FRET-based assays were used to study intramolecular bivalent glue activity for the interaction between BRD4 and DCAF16, two proteins involved in the ubiquitin-proteasome system that are linked to certain cancers.
Ternary complex formation between the glue and these two proteins could be measured by TR-FRET using a europium-labeled antibody against BRD4 and Cy5-labeled DCAF16 (Fig. 2). Dissociation binding constants (KD) were determined on the PHERAstar FSX and the results highlighted new interaction mechanisms for novel molecular glue degraders.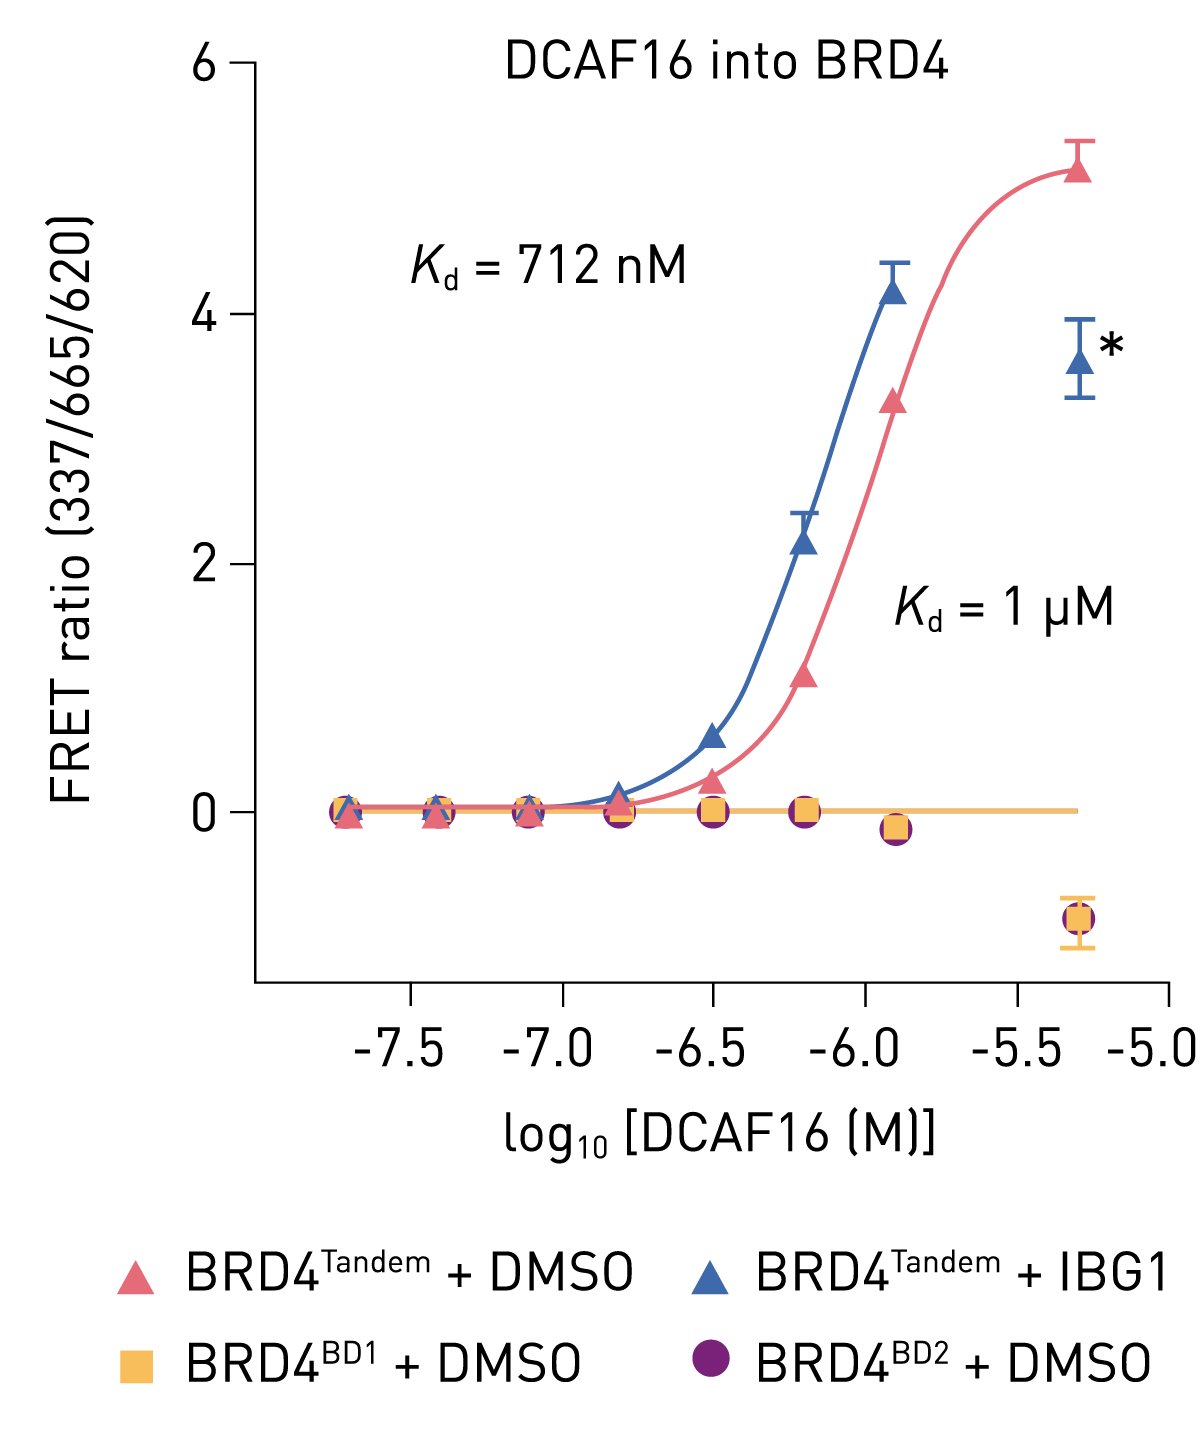 In the scientific talk A TR-FRET approach to measure the kinetics of ligand-receptor binding and its application of fragment screening, Professor Steven Charlton discusses a TR-FRET kinetic approach to simultaneously detect the kinetics of multiple compounds. This is demonstrated by a description of a dopamine D2 receptor fragment screening campaign.

While protein-protein interactions are widespread in biological systems, interactions between biomolecules are incredibly diverse. For example, proteins may also interact directly with other biomolecules like nucleic acids. In the application note AN312 Protein-induced fluorescence enhancement detects protein-nucleic acid interactions in microplates, a fluorescence assay (protein-induced fluorescent enhancement assay) was used to study the interaction of the DNA repair protein Ku with biologically relevant oligonucleotides on the Omega series microplate reader. This protein-induced fluorescent enhancement assay is a straightforward and high throughput method that does not require protein labeling and can be applied to a wide range of protein-nucleic acid interactions.7 Using this method, the calculated KD for Ku/DNA interaction was 10 ± 5 nM, which is within the range previously determined by other experimental approaches. 7 In addition to protein-nucleic acid dissociation constants (Fig. 3), this fluorescence approach can be used to look at sequence and structure binding specificities, detection of weak interactions, and the ability of a protein to translocate along DNA. 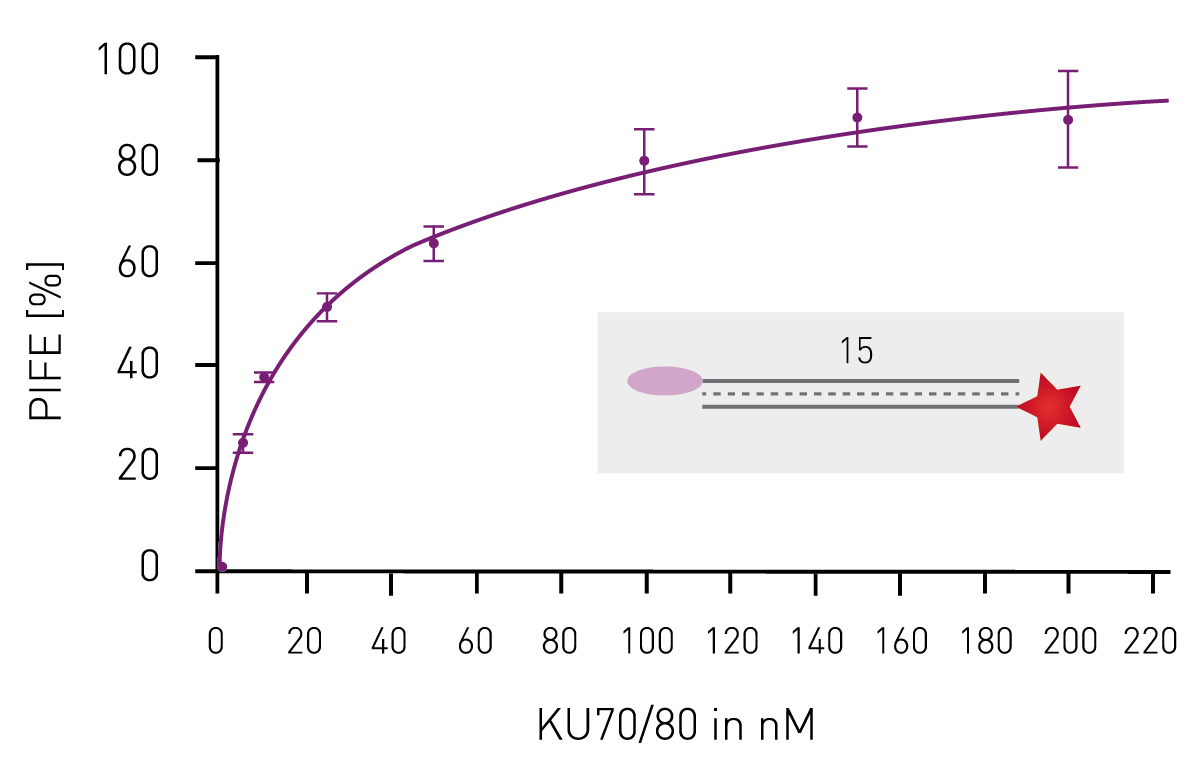
KD values can also be determined using competition binding assays. In a competition assay, an untagged ligand competes with a tagged ligand for binding to the same site on a target molecule. These assays are used to describe and quantify the binding interactions between ligands and their targets. The concentration of the unlabeled ligand that displaces a certain percentage of the tagged ligand from the binding site is measured. This decrease in signal that arises reflects the binding affinity of the ligand to the target biomolecule. The KD value of the untagged ligand of interest can be calculated from its IC50 value using the Cheng-Prusoff equation: 8
 In this equation, IC50 is the amount of unlabeled ligand that displaces 50% of tagged ligand from the target biomolecule, [T] is the concentration of tagged ligand, and KDT is the equilibrium dissociation constant of the tagged ligand and target biomolecule complex.
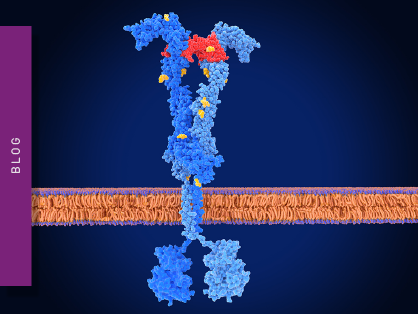
In the application note AN287 NanoBRET™ assay for monitoring of ligand binding to GPCRs in live cells, using the CLARIOstar® and the PHERAstar® FSX a luminescence-based NanoBRET assay was used in competitive binding experiments to calculate binding affinities (KD values) for ligands to GPCRs in live cells.9 The donor luciferase NanoLuc was used in a nonradioactive, proximity-based interaction assay for this purpose. A GPCR was expressed in live HEK293 cells with NanoLuc luciferase at the N-terminus. The receptor ligand was labelled with a different fluorophore whose excitation spectrum overlapped the emission spectrum of NanoLuc. When the ligand was not bound to the receptor, only the blue emission of NanoLuc was detected. In contrast, when the ligand was bound to the receptor, red fluorescence was detected due to excitation of the fluorescence label by resonance energy transfer. This experimental system permitted accurate determination of binding affinities for a cell-based GPCR assay.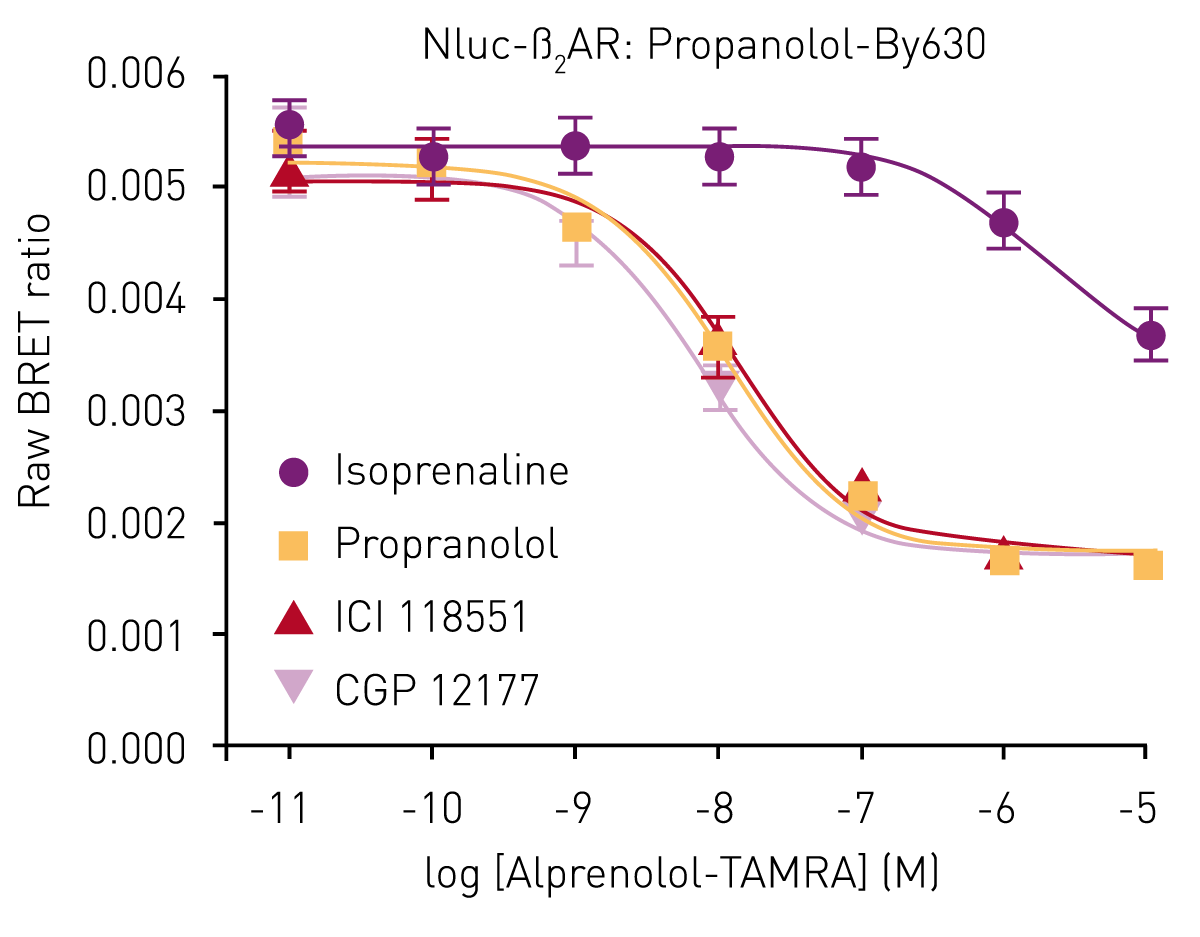 In the application note AN256 Protein-ligand binding measurements using fluorescence polarization binding affinities (KD values) were determined from competitive binding assays with a multiprotein complex of human Lys-specific Histone Demethylase 1 (LC1 complex), an enzyme involved in chromatin remodeling. The binding interaction to a heterodimer of this enzyme was studied using TAMRA (5-carboxytetramethylrhodamine) fluorescently labeled histone peptides using fluorescence polarization measurements on both the CLARIOstar and PHERAstar (Fig. 5). Dissociation constants were also determined from direct binding experiments. Experiments with different peptide ligands generated KD values in the range 76.4 ± 10.4 nM to 316.6 ± 59.9 nM.
 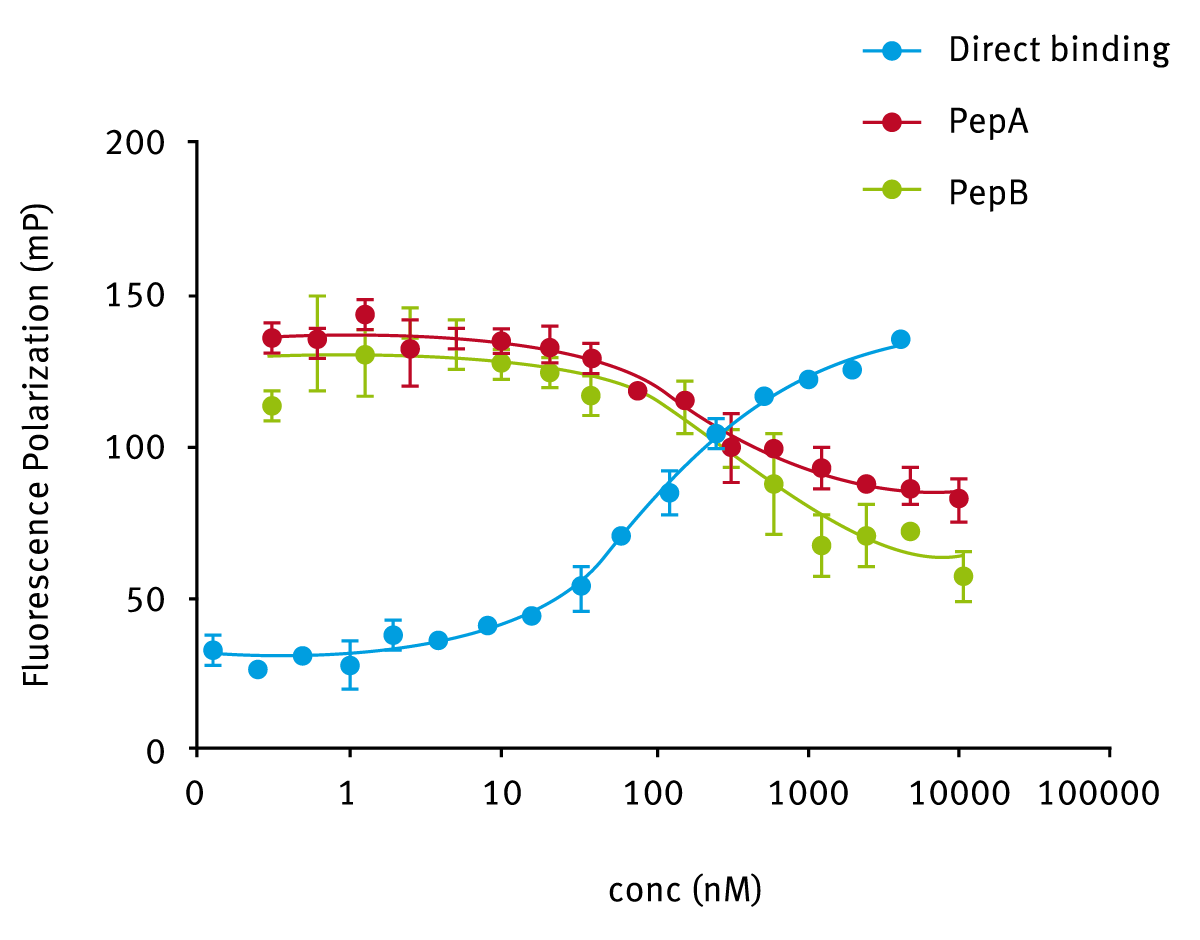 Table 1. Summary of benefits offered by microplate readers for measuring binding constants.
We have already highlighted some of the technological features of a microplate reader that facilitate the study of biomolecule-ligand interactions in the blog Receptor-ligand interactions. Some of the instrument features relevant to the measurement of binding constants are summarized in Table 1.
| Feature | Benefit | Note |
| Simultaneous Dual Emission | Halves read time and improves data quality for all dual emission assays, such as FRET, TR-FRET, fluorescence polarization, and BRET, as the reader can detect two emission wavelengths in a single measurement. | Available on the PHERAstar FSX |
| Enhanced Dynamic Range | Ensures accurate signal quantification across low to high concentrations of ligands and targets without running into the risk of signal saturation | Available on the PHERAstar FSX, VANTAstar and the CLARIOstar Plus |
| Sampling rate | Sampling rate of 100 data points per second. Particularly useful for resolving fast kinetic processes and for generating higher density datasets of interaction events | Sampling rates for PHERAstar FSX and the CLARIOstar Plus |
| TRF laser | With 60 laser flashes per second, it allows ultra-fast TR-FRET kinetic measurements, and even “flying mode” detection | Available on the PHERAstar FSX |
| Injectors | Injection and simultaneous detection are useful for fast reactions and kinetic measurements. Significant asset for reading in kinetic well mode since they offer the best performance in terms of speed and throughput (sampling rate) | All BMG LABTECH microplate readers come with up to two injectors per reader and are compatible with plate formats up to 384 wells |
| Range of throughput options and automation | Accelerates measurements and is particularly useful for screening campaigns. Support for 96-, 384-, 1536- and 3456-well microplate formats | BMG LABTECH readers offer excellent robotic integration capabilities, multi-user control, digital signature and FDA 21 CFR part 11 compliance. Robotic software interface permits easy integration into all leading robotic platforms. |
| Atmospheric Control Unit | Independently control oxygen and carbon dioxide concentrations for cell-based assays (as low as 0.1% oxygen on the CLARIOstar Plus) | Ideal selection for plate and well-mode kinetic measurements that require specific atmospheric conditions and rapid sampling |
| Advanced Assay Stability (AAS) | Maintains constant temperatures between 18 and 45°C by automatically heating or cooling the measurement chamber. Prevents environmental fluctuations from affecting assay performance, enabling consistent conditions throughout entire batches or screening campaigns | Available on the PHERAstar FSX |
Whatever your requirements, BMG LABTECH has the microplate reader for your receptor-ligand kinetics assay whether you are interested in cell signaling, drug discovery or another application.
The PHERAstar FSX was specifically conceived for screening campaigns and is your go-to reader for the fastest high-performance high-throughput screenings.
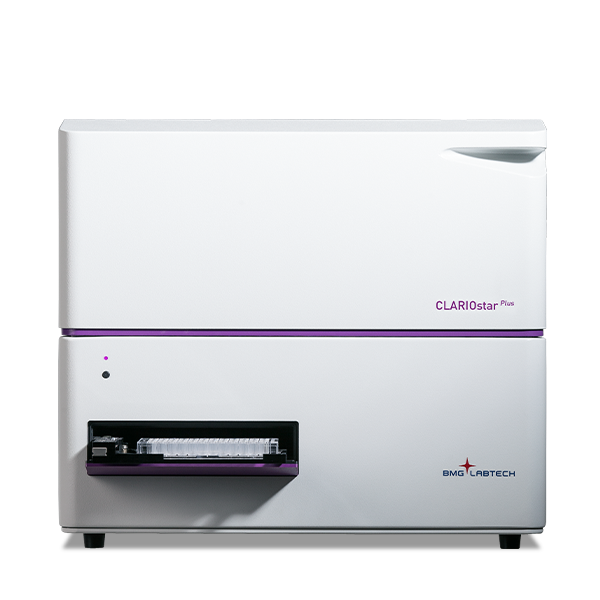
Both the VANTAstar® and CLARIOstar Plus allow for wavelength flexibility and include Enhanced Dynamic Range technology for superior performance in a single run of endpoint and kinetic mode assays. They also offer increased light transmission and sensitivity courtesy of Linear Variable Filter MonochromatorsTM and different filter options for endpoint and kinetic mode assays.
All BMG LABTECH microplate readers have exceptionally fast reading capabilities for endpoint and kinetic mode assays. In addition, the Omega series, CLARIOstarPlus, and PHERAstar FSX microplate readers can be equipped with on-board injectors that can offer the very best options for detection at the time of injection for endpoint and kinetic mode assays.
Collectively, BMG LABTECH multi-mode readers combine high-quality measurements with miniaturized assays, short measurement times, and offer considerable savings on materials and other resources for endpoint and kinetic mode assays.
FDA. Drug Development & Approval Process. U.S. Food and Drug Administration. https://www.fda.gov/drugs/development-approval-process-drugs. Published 2021. Accessed January 14, 2026.
Hoare S. Analyzing Kinetic Binding Data. Ncbi.nlm.nih.gov. https://www.ncbi.nlm.nih.gov/books/NBK569501/. Published 2021. Accessed January 14, 2026
Mangold M. How to determine binding affinity with a microplate reader. bmglabtech.com. https://www.bmglabtech.com/how-to-determine-binding-affinity-with-a-microplate-reader/. Published 2021. Accessed January 14, 2026.
Molecular Biology of the Cell, 4th edition Bruce Alberts, Alexander Johnson, Julian Lewis, Martin Raff, Keith Roberts, and Peter Walter. New York: Garland Science; 2002.
Cooper, G.M. (2000) Signaling molecules and their receptors. In The cell: A molecular approach (2nd ed.). Sunderland, MA: Sinauer Associates.
Raven, P. H., Johnson, G. B., Mason, K. A., Losos, J. B., and Singer, S. R. (2014) Cell communication. In Biology (10th ed., AP ed., pp. 168-185). New York, NY: McGraw-Hill.
Valuchova S, Fulnecek J, Petrov AP, Tripsianes K, Riha K. A rapid method for detecting protein-nucleic acid interactions by protein induced fluorescence enhancement. Sci Rep. 2016 Dec 23;6:39653. doi: 10.1038/srep39653.
Cheng, Y.C.; Prusoff, W.H. Relationship between the inhibition constant (Ki) and the concentration of inhibitor which causes 50 percent inhibition (IC50) of an enzyme reaction. Biochem. Pharmacol. 22, 3099-108 (1973)
Stoddart LA, Johnstone EKM, Wheal AJ, Goulding J, Robers MB, Machleidt T, Wood KV, Hill SJ, Pfleger KDG. Application of BRET to monitor ligand binding to GPCRs. Nat Methods. 2015 Jul;12(7):661-663. doi: 10.1038/nmeth.3398.
Powerful and most sensitive HTS plate reader
Most flexible Plate Reader for Assay Development
Flexible microplate reader with simplified workflows
Upgradeable single and multi-mode microplate reader series
Receptor-ligand kinetics is the study of the rates at which receptors and ligands interact, bind and dissociate. Learn why these types of measurements are important and how to measure them.
Receptor-ligand interactions are crucial for cell signalling. They are also important for drug discovery. How do microplate readers deliver benefits to both?
Redox processes play an important role in cell homeostasis. Read here, how to monitor cellular redox changes with roGFP using the most sensitive, high-performance plate readers from BMG LABTECH.