Introduction
Due to the crucial role of G protein-coupled receptors (GPCRs) in mediating cellular responses to external stimuli, these receptors have been and will remain a prime focus for medical research and the pharmaceutical industry for many years to come. Their importance is especially highlighted by the statistic that 30-50% of marketed pharmaceuticals target GPCRs.
Current binding assay techniques for studying the binding kinetics of ligands and GPCRs include use of radioactivity, fluorescent ligands and FRET (fluorescence resonance energy transfer). BRET (bioluminescence resonance energy transfer)1 requires only the addition of a suitable substrate to generate donor light emission, as well as energy that can excite fluorescently-labelled ligands in a non-radiative manner. The donor luciferase enzyme can be expressed on the N-terminus of the receptor of interest in an appropriate transfected cell line. Theoretically, BRET should be more sensitive than FRET-based assays, however the practical difficulty of finding a suitable luciferase enzyme amenable to such N-terminal fusion has hampered the development of a BRET assay for ligand binding studies.
Recently, researchers at Promega have developed a genetically engineered luciferase called NanoLuc® (Nluc) from a natural luciferase isolated from deep sea shrimp.2 Nluc is of relatively small molecular weight (19kDa) and is very stable (up to 55°C). Unlike other luciferase-GPCR fusion constructs, it is readily expressed on the N-terminus of GPCRs and efficiently transported to the cell membrane.3
Assay Principle
 In this particular example, a GPCR is expressed in live cells with Nluc luciferase on its N-terminus.3 A ligand of this receptor is then labelled with a fluorophore that has an excitation spectrum overlapping the emission spectrum of Nluc. The ligand is introduced to the live cells followed by addition of the Nluc substrate (furimazine). If the ligand does not bind to the receptor, only the blue emission of Nluc is detected. If the ligand binds specifically to the receptor, excitation of its fluorescent label by resonance energy transfer from the Nluc results in red fluorescence also being detected. Competitive binding of unlabelled ligand then causes a concentration-dependent decrease in this red fluorescence (Fig. 1).
Materials & Methods
Detailed materials and methods are provided in the Online Methods of Stoddart et al.3
Stable cell line generation: The HEK293 cell line express-ing ß2 adrenergic receptor (ß2AR) was from Promega.
Fluorescently labelled ligands: Alprenolol-TAMRA was synthesised by Promega; propranolol-BY630 was obtained from CellAura; alprenolol was obtained from Sigma; isoprenaline, propranolol, ICI 118551 and CGP 12177 were obtained from Tocris.
Nluc and Rluc8 emission spectra: 24 h post-transfection, cells expressing either Nluc-ß2AR or Rluc8-ß2AR were incubated for 180 min at 37 °C in OptiMEM without phenol red (Gibco) in 96 well plates. The luciferase substrates furimazine (Nluc) or coelenterazine h (Rluc8), at a final concentration of 10 μM, were then added to the wells.
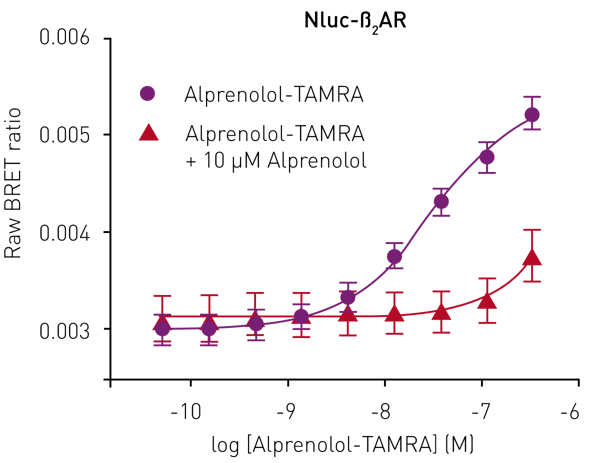
BRET ß2AR-ligand binding assays: HEK293 cells transfected with Nluc-ß2AR were assessed in 96 well plates. For saturation binding experiments using alprenolol-TAMRA, serially diluted alprenolol-TAMRA in the absence or presence of 10 μM alprenolol was added to the wells and the plate incubated for 120 min at room temperature. The furimazine substrate was then added to a final concentration of 10 μM. BRET was measured at room temperature. For the competition binding experiments, Nluc-ß2AR stably transfected HEK293 cells were incubated with 10 nM propranolol-BY630 and the required concentration of competing ligand diluted in HEPES-buffered saline solution for 1 h at 37 °C.
Instrument settings
Nluc and Rluc8 emission spectra: The emission spectra were determined with a CLARIOstar® plate reader using the luminescence scanning option of the monochromator (20-nm bandwidth; 1-nm resolution; integration time: 500 ms; gain: 3000).
BRET ß2AR ligand binding assays:
For the saturation binding experiments using alprenolol-TAMRA, the CLARIOstar plate reader was used in endpoint mode, using emission filters 450±40 nm (80-nm bandpass) and >610 nm (longpass). The wavelengths were read sequentially for each well (well multichromatics) at room temperature (integration time: 500 ms; gain: 3000 for both channels).
The PHERAstar® FS was used for the competition binding experiments and the saturation binding experiments with propranolol-BY630; endpoint mode, NanoBRETTM module (460 nm (80-nm bandpass) and >610 nm (longpass)). Both wavelengths were measured simultaneously at room temperature (integration time, 1000 ms; 460 nm gain, 2800; >610 nm gain, 3000).
The raw BRET ratio was calculated by dividing the >610-nm emission by the 460nm emission. The term “raw BRET ratio” is used, as no background ratio was subtracted.
Results & Discussion
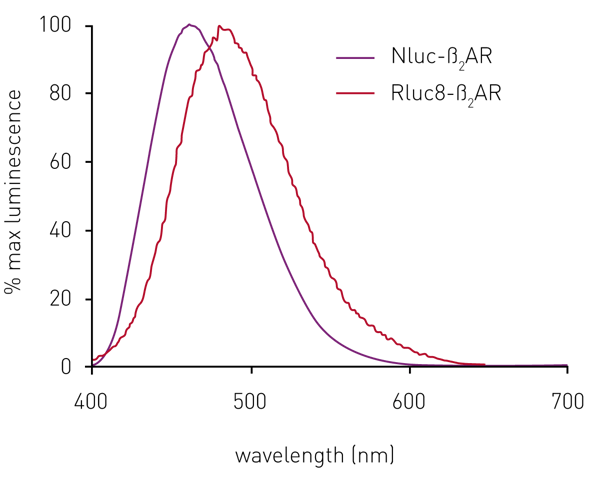
In initial experiments, sets of HEK293 cells expressing the ß2AR N-terminally-labelled with either Rluc8 or Nluc were both found to give a luminescent signal on addition of their respective substrates. The Nluc signal maximum was at 460 nm, compared to 480 nm for Rluc8 (Fig. 2). However, the relative signal strength was about 70 times greater for Nluc compared to Rluc8 (see data in Stoddart et al.3).
Although the emission spectrum of Nluc has a maximum at 460 nm, it has appreciable intensity to ~600 nm (Fig 2). This allows the use of a range of fluorescent labels on the agonist/antagonist GPCR binding partners of interest. For HEK293 cells expressing Nluc-ß2AR, the ß2AR antagonist alprenolol was labelled with TAMRA (Ex 565, Em 580).
Specific ligand binding was observed, which could be completely prevented by competition with unlabelled alprenolol (10 μM) (Fig. 3).
A second fluorescent ligand was then assessed, propranolol-BY630. From saturation binding experiments with this labelled antagonist binding to the receptor, an equilibrium binding constant (KD) of 18.9 ± 4.1 nM was calculated.
Most importantly, the BRET signal that was generated from the interaction of propranolol-BY630 with the receptor could be decreased by increasing concentrations of the unlabelled ß2AR antagonists propranolol, ICI 118551 and CGP 12177, and the agonist isoprenaline (Fig.4). From these experiments, pKi values could be calculated from the IC50 values of the three antagonists propranolol, ICI 118551 and CGP 12177 (8.13 ± 0.05, 8.04 ± 0.04 and 8.32 ± 0.03 respectively).3 Furthermore, these values were similar to those published using radioligand binding experiments,4 highlighting the suitability of this assay for drug discovery and profiling.
When using less than 25 Moi of virus sensitivity makes the assay unreliable.
The 96-well and 384-well results shown in Figure 4 are not comparable in their signal height as the 384 well plates were lysed in 2.5 fold more lysis buffer hence the relative luciferase units are approximately 2.5 fold lower than those obtained using 96 well plates. More lysis buffer was added to 384 well plates to ensure there was enough lysate to perform luciferase assay.
Conclusion
The above study firmly establishes the NanoBRETTM assay as a viable alternative to existing methods for determination of ligand binding to GPCRs. The method will be useful in basic research as well as the pharmaceutical industry.
References
- Pfleger, K.D.G. & Eidne, K.A. Nat. Methods 3, 165–174 (2006).
- Hall, M.P. et al. ACS Chem. Biol. 7, 1848–1857 (2012).
- Stoddart, L. et al. Nat. Methods 12, 661-663 (2015).
- Baker, J.G. Br. J. Pharmacol. 144, 317–322 (2005).
1 Cell Signalling Research Group, School of Life Sciences, The University of Nottingham Medical School, Nottingham, United Kingdom.
2 Molecular Endocrinology and Pharmacology, Harry Perkins Institute of Medical Research, Nedlands, Western Australia, Australia.
3 Centre for Medical Research, The University of Western Australia, Crawley, Western Australia, Australia.
4 Promega Corporation, Madison, Wisconsin, United States.
5 BMG LABTECH Pty Ltd, Mornington, Victoria, Australia.
NanoLuc is a registered trademark and NanoBRET is a trademark name of Promega Corporation.


