Introduction
Beyond discovering treatments that improve healing response, scratch wound assays are useful for studying cell interactions and migration1. While the common scratch wound assay is reasonably simple, its dependance on microscopy makes it low throughput.
Here we describe a scratch wound assay that can be performed in 96-well plates. Autobioluminescent cells prepared using 490 BioTech’s LiveLight Toxicity Assay Kit enabled their real-time localization with the CLARIOstar. Cell health was maintained during the scratch wound assay using the ACU option.
Assay Principle
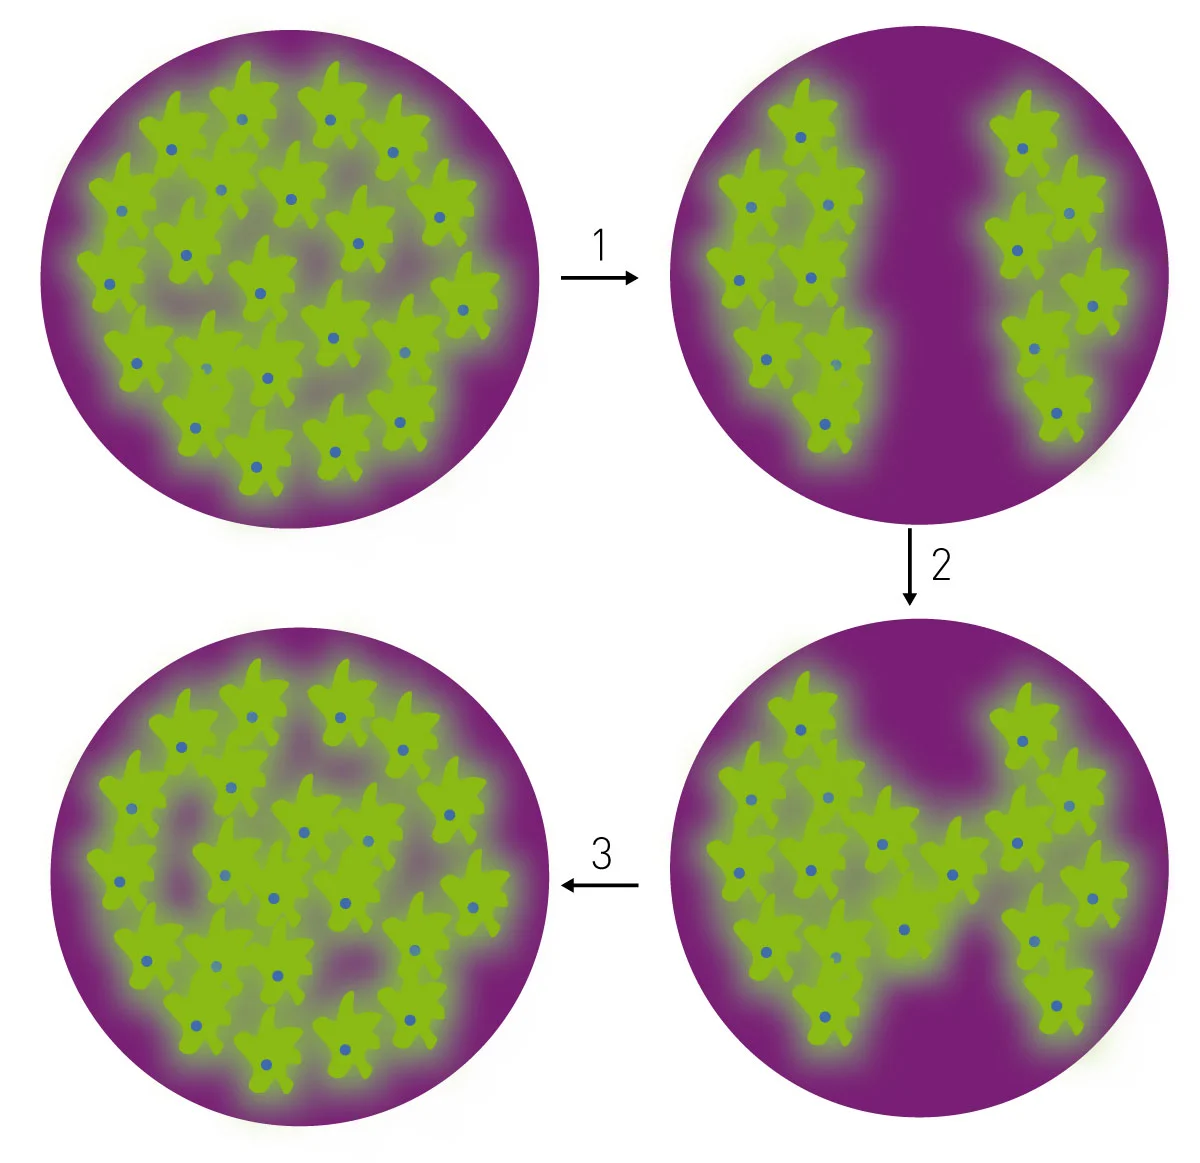
We have previously shown how 490 BioTech’s autobio-luminescent products can monitor cell health in real-time using microplate readers2. Here, we show how those same tools allow visualization of labeled cell movement over time. This scratch wound assay utilizes autobioluminescent cells to monitor wound healing using the well-scanning detection capabilities of the CLARIOstar (Figure 1).
Materials & Methods
- Costar 96-well, white, clear bottom plates (Corning)
- 490 BioTech, LiveLight Toxicity Assay Kit
- Matrigel (Corning)
- CLARIOstar with ACU
Experimental procedure
Astrocytes were plated at 40k cells/well in a 96-well plate coated with matrigel. Cells were grown under standard conditions (37 °C, 5% CO2) for 24 h to allow for attachment. After the 24 h attachment period the cells were transfected with the LiveLight Toxicity Assay Kit using 0.01 ng DNA per cell and further incubated for 24 h to allow uptake and continuous bioluminescent expression. At 24 h post transfection wounding was simulated by scratching the center of each well with a sterile 10 μL pipette tip to remove cells within a defined section of the plate.
Microplate reader procedure
At 0, 24, and 48 h post wounding, matrix scans were taken of each well of the scratch wound assay using the CLARIOstar to track bioluminescent and non-luminescent area dynamics.
Instrument Settings
| Optic settings | Luminescence, plate mode kinetic | |
| Emission | No filter | |
| Gain | 3600 | |
| Focal height | 2.2 mm | |
| General settings | Optic used | Bottom |
| Meas. Int. time | 1.00 s | |
| Scan settings | Mode | Matrix Scan |
| Dimension | 30 x 30 | |
| Width | 3 mm | |
| Incubation | 37 °C, O2 Monitoring, 5% CO2 | |
Results & Discussion
We first sought to show that microplate reader-based bioluminescent detection could recapitulate results seen with a microscope for a scratch wound assay. Figure 2 shows the same well of the scratch wound assay viewed via bright field microscopy and bioluminescent detection of over 700 individual positions within the well by the microplate reader.
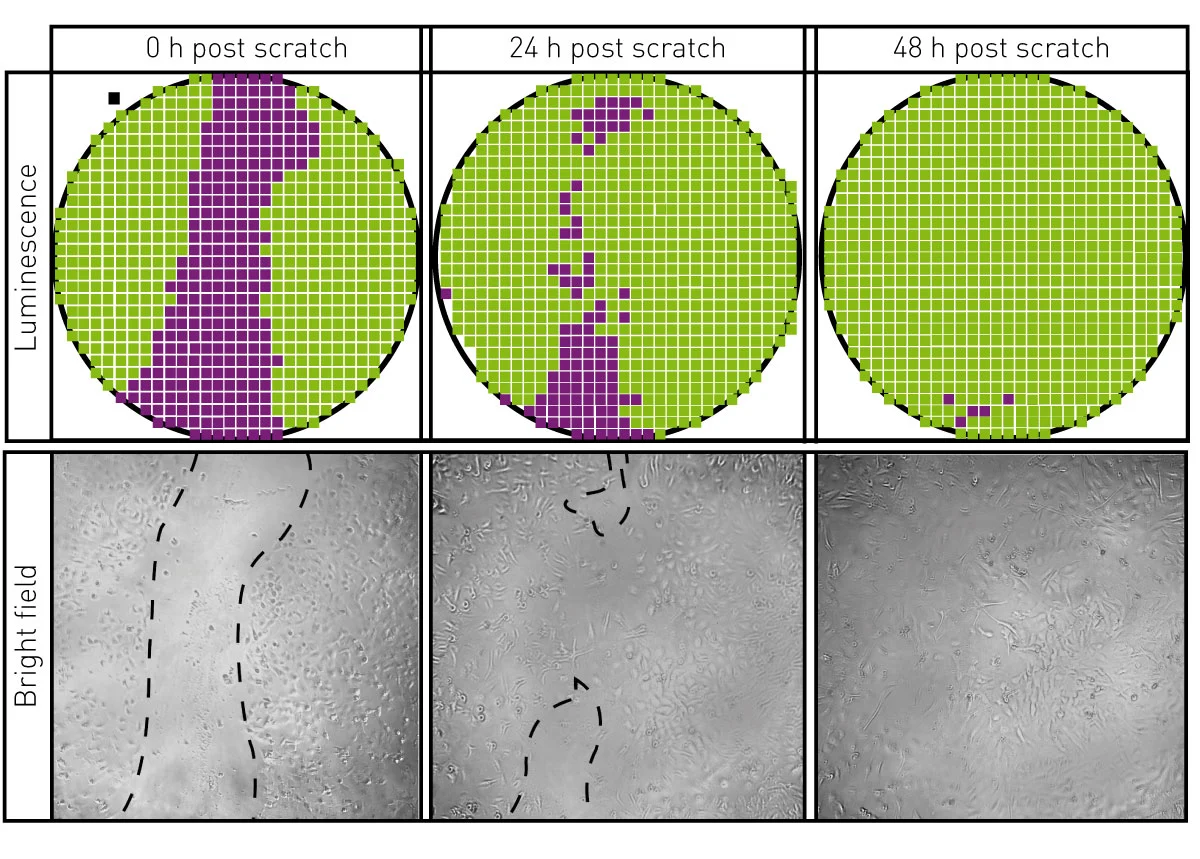
Bright field micrographs were captured at the indicated times during the scratch wound assay using an inverted microscope at 40× magnification. The wells were subsequently read using the CLARIOstar as indicated.
Repeated micrographs of the bright field images showed progressive recovery of cellular density to the area scratched at time 0 as expected. Well scan luminescent readings paralleled the microscope images, showing the utility of this method for the evaluation of a scratch wound assay.
We next sought a quantitative result for observed wound healing. Figure 3 shows the selection of areas within the well of the scratch wound assay in BMG LABTECH’s MARS data analysis software, which was used for the quantification of bioluminescence. Identical areas were selected for all time points to enable comparisons over time.
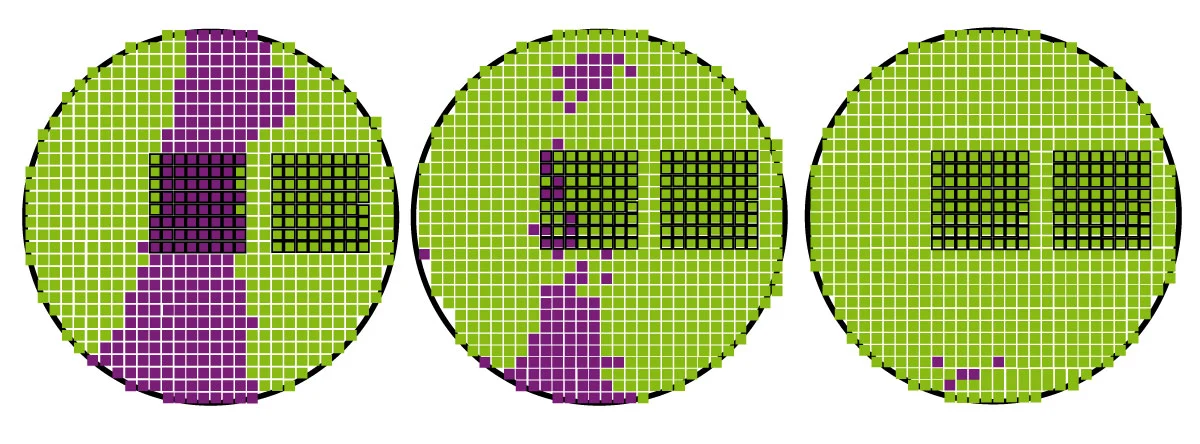
An 8×8 matrix was selected in the low bioluminescence (purple) ‘scratch zone’ (area 1) at 0 h. A corresponding area was selected in an unperturbed location with higher cellular density (green) for comparison (area 2). Identical matrices were employed at 24 and 48 h post scratch.
After an area is selected in MARS, statistics for that area of the scratch wound assay are generated including the average bioluminescence across all scan points. We calculated the ratio of the average bioluminescence in area 1 vs. area 2. Figure 4 shows the results of the quantitative analysis of the wound scratch assay over time, which correlate with the visual results of the scratch wound assay.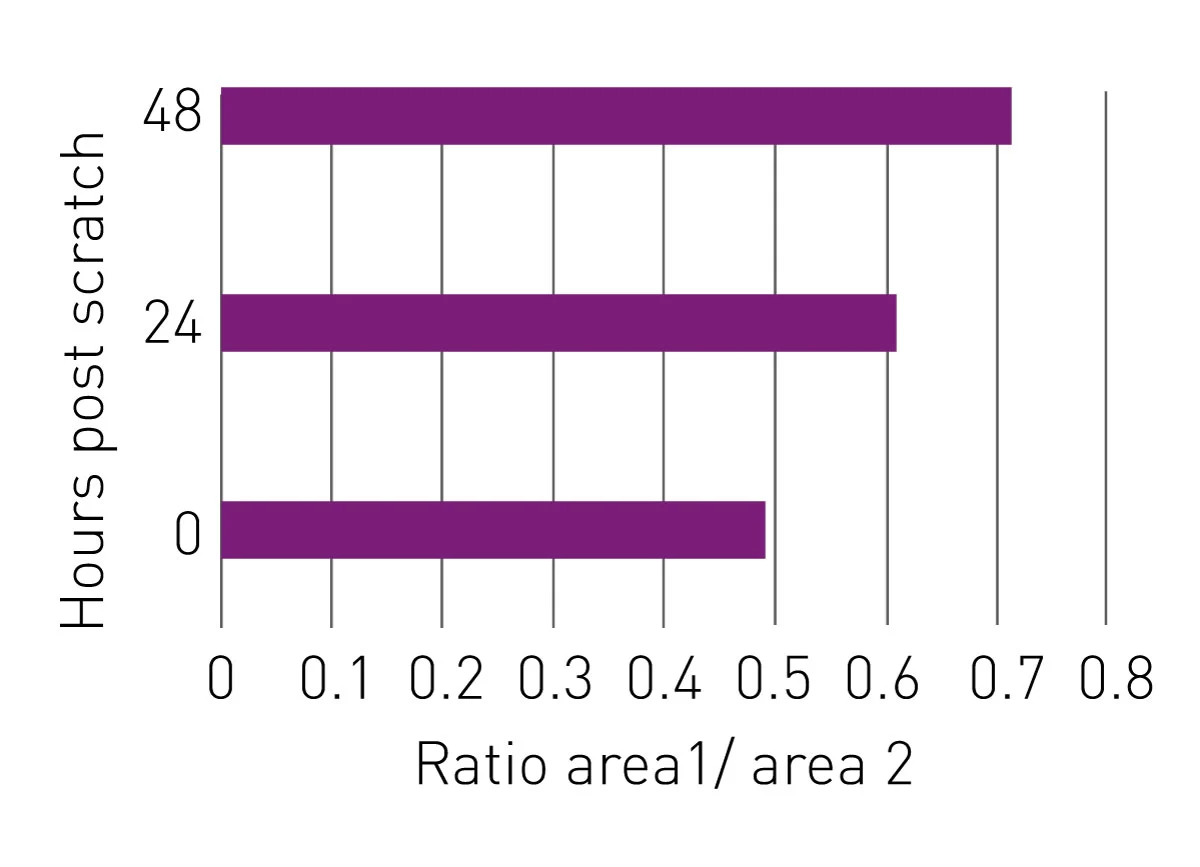
Conclusion
We show a proof of principle for using a microplate reader-based scratch wound assay. Bioluminescence of cells was visualized using well-scanning. The scratch wound assay results of the reader correlate well with microscopy results. Furthermore, MARS can assist in generating quantitative results which will likely be useful in comparing treatments to determine their effect on wound healing and will enable a throughput increase.
References
- Grada, A et al. Research Techniques Made Simple:Analysis of Collective Cell Migration Using the Wound Healing Assay Int. J. Invest. Dermatol. (2017) 137: e11-e16.
- Halter, K & Close, D. Autobioluminescent cells report real-time changes in cellular metabolism in response to pharmacological challenges. BMG LABTECH, AN 344