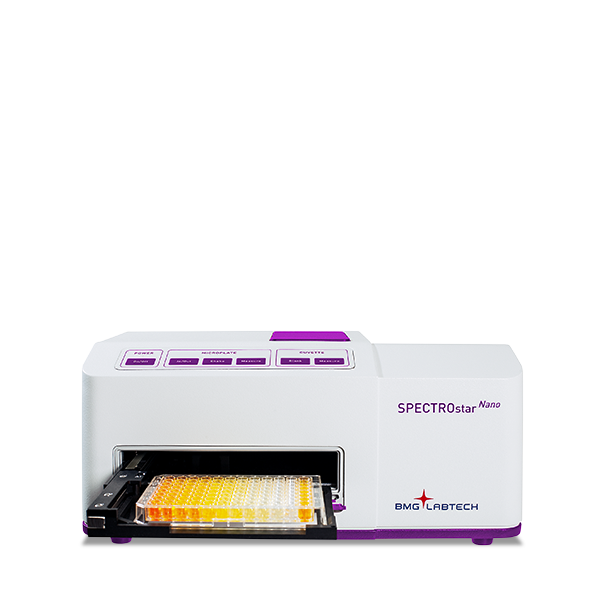
SPECTROstar Nano
Absorbance plate reader with cuvette port

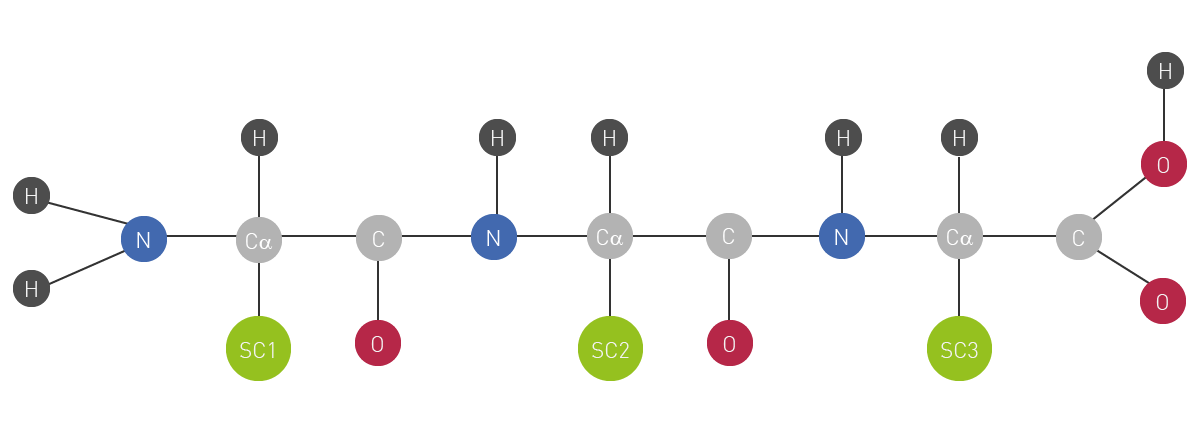
Next to carbohydrates, lipids and nucleic acids, proteins are one of the main macromolecule building blocks of life. On a molecular basis, they can be described as complex polymers of amino acids, connected via a peptide bond backbone (fig.1). There are 20 different types of amino acids available as possible residues of individual subunits of a protein. The combination of these amino acid residues finally determines each protein’s unique sequence and 3D structure. The latter in the end is responsible for the specialised function of a protein has within cells and tissues of living organisms.
Next to this unique sequence of amino acids, a large number of additional modifications can also be carried out, such as phosphorylation or glycosylation. Proteins play critical roles in the body.1 They participate in virtually every process within cells. Many proteins are enzymes, a special subcategory responsible for the catalysing of biochemical reactions and vital to metabolism. Others, like receptors and signal proteins facilitate signal transduction.
Considering the fundamental role of proteins in biology, it is not surprising that there is an extreme diversity of methods to study proteins. There are many different types and variations upon the major protein assay techniques. Determination of protein concentration is an elementary prerequisite for many downstream analyses like protein separation, chromatographic or immunochemical techniques or structural analysis2. Such downstream analyses are designed to employ proteins in specific concentration ranges. If the protein concentration is outside of the appropriate range, a dilution or concentration of the sample must be carried out beforehand.
The determination of protein concentrations provides information about the necessity of corresponding intermediate steps. Protein quantitation could either be required for the total protein content of a sample, or for purified subsets thereof, such as affinity column fractions. Protein quantification assays are also used to standardise other analysis results to the mass used. Since protein quantitation is an elementary prerequisite for many different downstream applications, it is the most frequently practiced protein assay.
The specific identification of individual proteins is mainly used for many clinical and research processes. The concentration of hormones, cytokines or enzymes associated to specific metabolic states or pathological variations are evaluated as a final step in a clinical laboratory as part of a disease diagnosis. Other protein assays include for example mass determination of proteins, the testing of their activity, the determination of the exact amino acid sequence as well as interaction studies.
The exact quantification of proteins often determines the success or failure of an experiment. There are various assays available to quantify the total protein concentration of unknown samples. They differ in the assay principle, way of detection and also in their sensitivity. Protein quantification assays for the detection on microplate readers are available mainly as absorbance-based protein quantification methods or as fluorescence-based protein quantification methods.
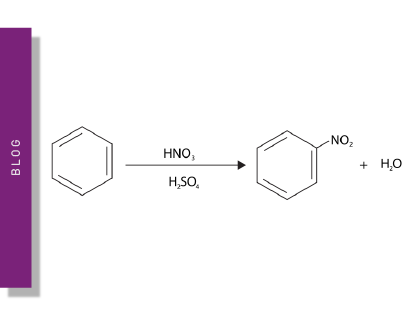
The easiest way to detect proteins with total protein assays is to measure absorbance at 280nm. The so called ‘Warburg-Christian method’ employs the natural absorbance of the amino acids tryptophan, tyrosine and phenylalanine which are generally present as residues in most protein samples (fig. 2). The method is not based on a standard dilution series but gives a direct measurement of the protein concentration. This circumstance avoids the addition of further reagents for the determination but is responsible for a major disadvantage of the method: The calculation of total protein amount is based on the percentage share of the mentioned amino acids in all amino acids of a protein. However, the proportion of tryptophan, tyrosine and phenylalanine varies greatly depending on the individual protein, leading to a high protein-to-protein variation of the extinction coefficient, needed for the calculation of the protein concentration.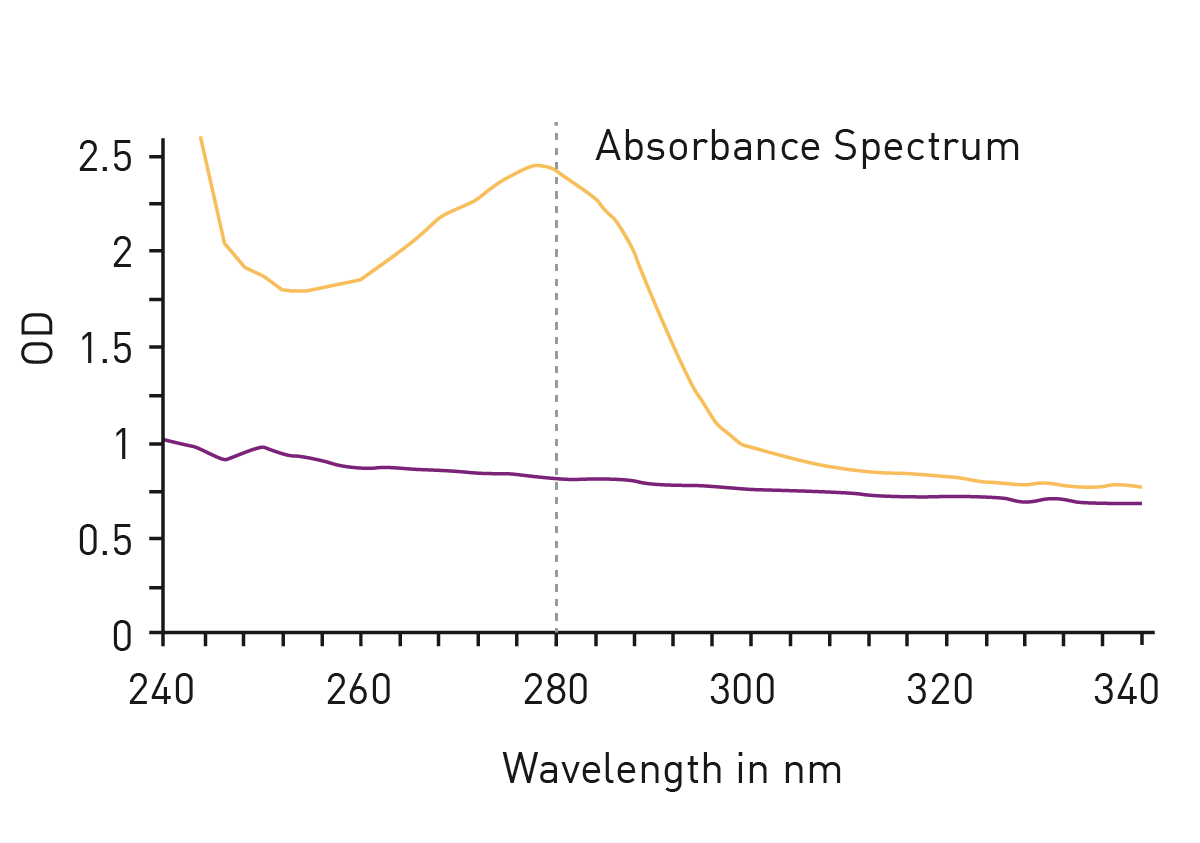
All colorimetric protein quantification assay methods share the same assay procedure. Typically, the protein-containing sample is added to a reagent that produces a color change upon protein-dye binding. This color change is proportional to the amount of added protein. All colorimetric protein assays require a standard curve to be analysed in parallel for the calculation of absolute protein concentrations. For this, bovine serum albumin is typically applied as a standard in colorimetric assays.3 One of the main differences to take into account when choosing a total protein assay is the compatibility with different detergents and solvents.
Bradford protein assay
The Bradford protein assay is based on an absorbance shift of the Coomassie Brilliant Blue G-250 dye from 470 nm to 595 nm upon association with proteins under acidic conditions.4 With the Bradford method it is possible to detect proteins down to a concentration of 1 µg/mL. Unlike other protein assays, the Bradford assay is less susceptible to the interference by various potential contaminants, like salts, solvents, thiols or any reducing substance. It is however incompatible with detergents like SDS, which are commonly found in lysis buffers.
Biuret test-derived protein assay
Biuret test-derived assays like the bicinchoninic acid assay (BCA assay) or the Lowry assay are copper ion-based. The peptide bonds found in proteins are capable of reducing Cu (II) sulfate to Cu2+ which is employed as a substrate e.g., by the bicinchoninic acid assay BCA protein assay kits5. Cu2+ can then in turn be made visible with colorimetric reagents, also contained in the BCA kit. In the BCA assay the copper ions chelate with BCA itself. BCA in turn shifts its absorbance maximum from ~ 700 nm to 562 nm in the BCA assay. The BCA protein assay reaction can be easily recognised by eye, as the purple-colored product is clearly distinguishable from the green educt. In the BCA protein assay, the intensity of the colored product is proportional to protein concentration in the sample. The BCA protein assay is a very popular assay to detect the protein concentrations of samples with bicinchoninic acid. Furthermore, most BCA protein assay kits are detergent-compatible with samples that contain up to 5% surfactants, derived from lysis buffers like the RIPA buffer.
In contrast to the BCA assay, the Lowry protein assay employs the Folin-Ciocalteu reagent, which together with Cu+ ions results in a blue complex, absorbing between 500 and 800 nm. Biuret test-derived protein assays like the BCA assay or the Lowry assay, based on bicinchoninic acid or Folin-Ciocalteu respectively, are compatible with most detergents but are susceptible to reducing agents such as DTT.
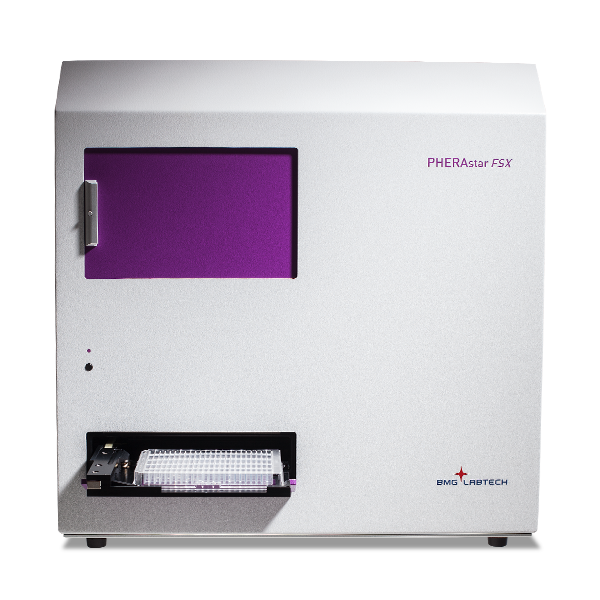
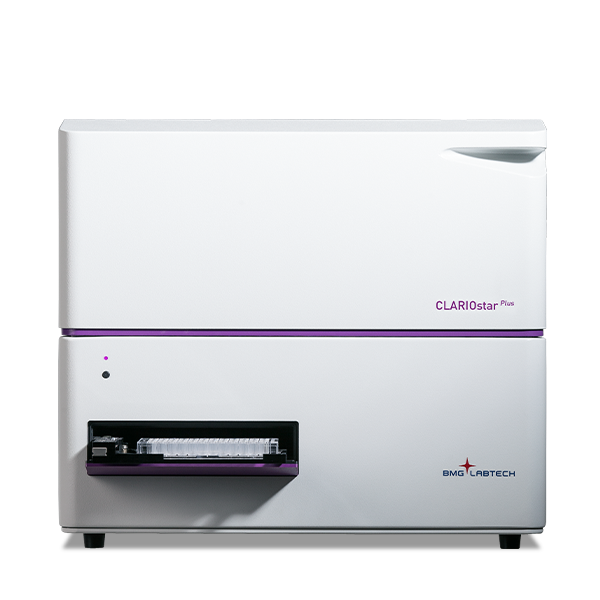
The A280 method, as well as all colorimetric protein assays for quantification of protein content, like the BCA assay, can be measured within a cuvette in a photometer. To increase throughput, the transfer of their detection to a microplate reader is suggested. BMG LABTECH's spectrometer-equipped microplate readers, namely the PHERAstar FSX, the CLARIOstar Plus, the Omega series, the VANTAstar and the SPECTROstar® Nano, are all capable of easily analysing the aforementioned protein assays.
Coomassie Blue staining
Besides their application in the Bradford method, Coomassie blue dyes are also commonly used to stain proteins in SDS-PAGE gels 6. Proteins are separated based on electrophoresis according to their size. Coomassie blue is used to stain the gels to verify the success of the separation, get an impression of the protein concentration at a specific size or check the successful transfer of the protein from the gel to the blotting membrane for the subsequent Western Blot.
Fluorometric protein quantification assays are based on a similar principal as colorimetric protein assays. The protein-containing sample is added to the reagent which typically directly binds the protein, leading to a fluorescence increase proportional to the added protein content. The available fluorometric assays equally require the parallel analysis of a standard curve with known protein concentrations. Fluorometric protein assays usually provide the best sensitivity and therefore get by with small sample volumes for the protein quantification procedure. Examples for such assays are Qubit® and Quant iT®, EZQ® as well as the NanoOrange® protein assay which allows to detect proteins down to concentrations of 10 ng/mL.
If you are not only interested in how much protein is present in your sample but also want to check the presence of a specific protein, there are other protein assay options for this purpose.
Enzyme-linked immunosorbent assays (ELISAs) are based on antibodies binding specifically to unique epitopes of a protein. Attached to these antibodies, the protein assays employ either an enzymatic conversion of a substrate to a colorimetric or luminescent product or fluorophores. Advanced antibody-based methods use Time Resolved Fluorescence (TRF) or TR-Förster Resonance Energy Transfer (TR-FRET) readouts which offer higher sensitivity and are ideally suited for high-throughput approaches (fig. 3), like shown in this application note with the THUNDER TR-FRET kits or this one using DELFIA chemistry to detect a TRF ELISA.
Such techniques are also able to detect protein modifications like phosphorylations or protein nitration. Using immunoelectrophoretic methods, like SDS-PAGE combined with a Western Blot, proteins are first separated according to their size by electrophoresis and in the following detected with specific antibodies 7. Protein immunoprecipitation is also based on the binding of specific antibodies to epitopes within the protein. Here, this binding event leads to the precipitation of the complex out of solution and its successive detection.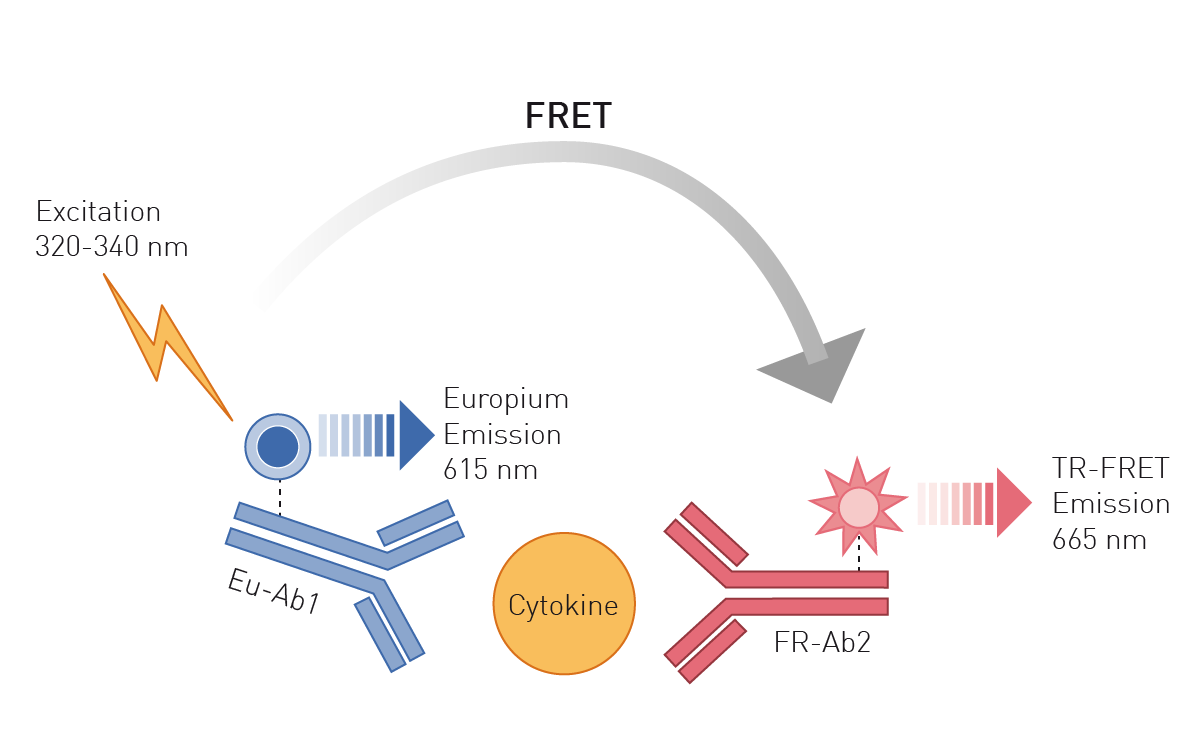
Another option for the identification of individual proteins or peptides is HPLC – high pressure liquid chromatography 8. While being pushed through a column together with liquid solvent, different amino acid side chains interact differently with the column material. That way, the proteins are fractionated as they flow out of the column. Fractions are afterwards detected e.g., with UV/vis spectrometry. Liquid chromatography eluents can also be characterized according to their mass. Mass spectrometry determines the mass-to-charge ratio of a protein or its peptide fractions. Protein or peptide mass can equally be used for the protein characterization and identification.
The mentioned methods can also be used to study post-translational modifications like glycations and phosphorylations. This is a standard procedure to monitor consistency in protein production batches and also heterogeneity within a batch.
Using Edman degradation, proteins can be sequenced step by step to identify not only the amino acids they contain, but also the order in which they appear in the protein chain 9. In this protein assay, phenylisothiocyanate chemistry is employed to cleave single amino acids from the N-terminal end of proteins.
Besides the identification of proteins via their mass and the accessible antigens, they can also be characterized based on their function and activity. This specifically applies to receptors or enzymes. Enzyme activity can for example be monitored by the turnover of a substrate to a colorimetric or fluorescent product. Receptor functionality is often confirmed by the binding of a specific ligand, monitored via interaction assays. Additionally, ligand binding to a functional receptor can be monitored via detecting the triggered signaling pathway.
Furthermore, novel approaches are developed to perform protein functionality screenings in high throughput. These allow to rapidly evaluate or in some cases even synthesise and evaluate protein variants as highlighted in AN385: Cell-free extract protein synthesis: Rapid single vessel DNA assembly and protein production in microliter scale. Protein structure can for example be determined by measuring unfolding of a protein linked to tryptophan fluorescence as shown in the AppNote Protein Stability Measurements using a Plate Reader.
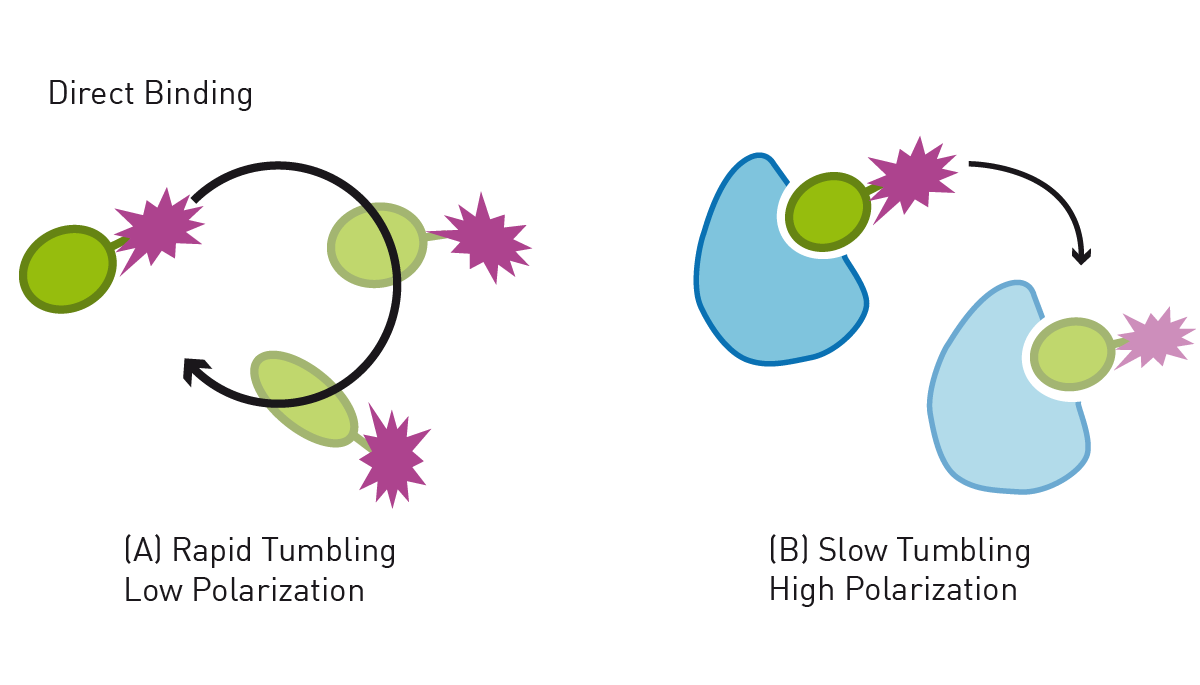
Proteins may interact with other proteins, nucleic acids or other molecules as part of their function. Such protein interaction events may be monitored e.g., with fluorescence polarization (FP) assays, whereby one, usually the smaller interaction partner, is labelled with a fluorophore. Upon interaction, the size of the interaction complex increases, leading to an increased FP signal (fig. 4). By labelling both potential interaction partners, binding events can also be evaluated with BRET, FRET or TR-FRET assays. These methods can also be used to localise a protein like shown in the AppNote FRET-based assay to detect membrane-bound enzyme (MraY) activity. Here the FRET donor is attached to the protein of interest, while the acceptor is localized at the cell membrane. FRET signal is only generated if the enzyme is present on the cell membrane. Alternative approaches, such as e.g. HiBiT CETSA, can even be performed without the need of tracers by utilizing protein fusion tags.
All of the mentioned assays can also be applied as competitive assays, whereby a labelled interaction partner of known affinity is in concurrence to different unknowns, like implemented in this application note on a high-throughput method to study kinase inhibitors. This approach is especially advantageous when screening binding events with big libraries of substances since it avoids labelling of all the individual components.
Aggregation is a special form of protein interaction, leading to a substantial increase of protein size. Such aggregation events can be studied with light scattering, with bigger aggregates leading to increased scattering compared to single smaller molecules. This application note gives an example of an absorbance-based approach to monitor protein aggregation in a kinetic measurement. The use of fluorescent dyes helps to increase sensitivity. Upon binding of the dyes to formed protein aggregates, they increase their fluorescence intensity substantially which allows to detect aggregate formation earlier in the kinetic assay. In the following example, Thioflavin T was used to detect fibrillization of Abeta in real-time.
Microplate-based protein assays enable to quantitate proteins, study their functions and interaction events using very reduced sample volumes. Multi-mode microplate readers such as the PHERAstar® FSX, the CLARIOstar Plus, the Omega series and the VANTAstar® combine different detection modes in one device. Thereby the allow the multiplexed measurement of various protein assays, which helps to address different scientific questions in the same attempt. Dedicated features such as ultra-fast signal detection and reagent injectors available on BMG LABTECH microplate readers can be used to analyse protein interaction assays with even greater detail and sensitivity.
These possibilities are particularly important in high-throughput screening approaches for the identification of new drugs and treatment options, as dysregulated protein interactions are often involved in disorders and disease. Features like simultaneous dual emission for the detection of two emission wavelengths upon the same excitation events in FRET/TR-FRET and FP assays, save time, decrease data variability and improve data quality. Especially for TR-FRET and AlphaScreen applications, BMG LABTECH readers allow to increase sensitivity substantially with dedicated lasers at 337 and 680 nm, respectively.
Absorbance plate reader with cuvette port
Powerful and most sensitive HTS plate reader
Most flexible Plate Reader for Assay Development
Upgradeable single and multi-mode microplate reader series
Flexible microplate reader with simplified workflows
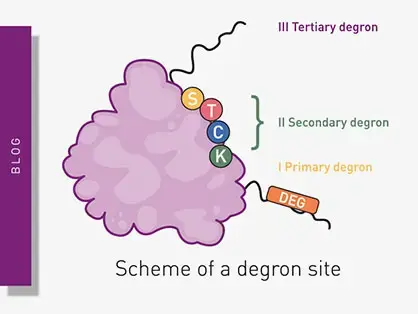
Degrons are specific sequences of amino acids or structural motifs within a protein that are important for targeted protein degradation. Find out how microplate readers can advance research into natural and engineered degrons.
Nitration can significantly modify the structure and function of proteins in cells. But how can measurements of protein nitration reveal crucial information about biological activity and how can microplate readers help?
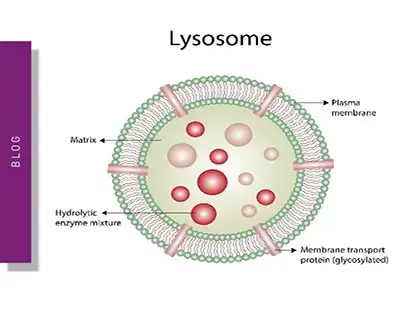
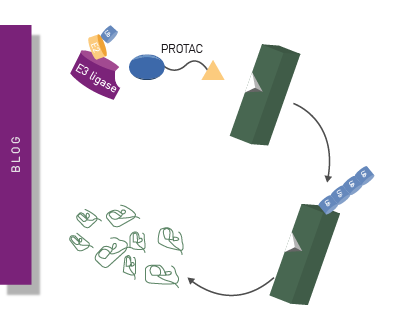
Innovation for targeted protein degradation and next-generation degraders is gathering pace. This blog introduces some of the different approaches that act via the lysosome or proteasome.
The choice of assay for targeted protein degradation studies is crucial. But what is the preferred assay and detection technology for your specific research needs and microplate reader?
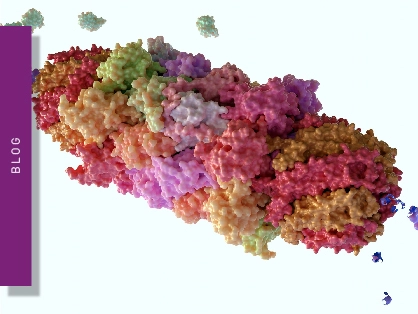
Molecular glues are small molecules that help target unwanted proteins for destruction by the ubiquitin-proteasome system. Find out how microplate readers can advance molecular glue research.
PROTACs are small, readily designed molecules that target unwanted proteins to the cell’s ubiquitin-proteasome system for degradation. Find out how microplate readers can advance PROTAC research.