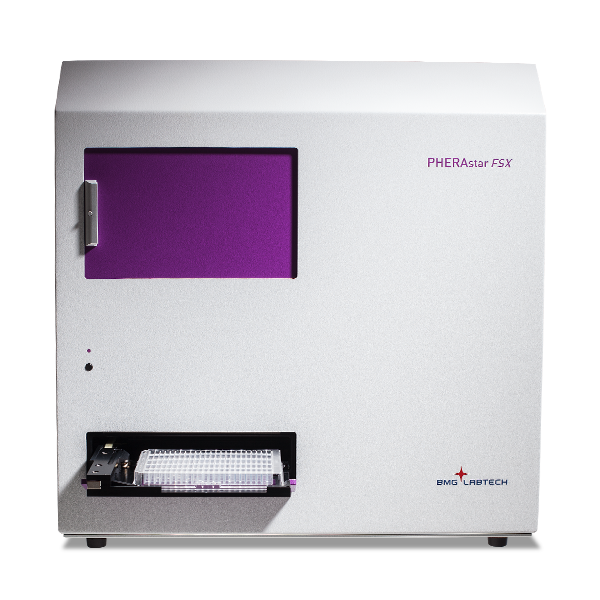
PHERAstar FSX
Powerful and most sensitive HTS plate reader


Dr. Martin Mangold works as an Applications Specialist at BMG LABTECH headquarters in Ortenberg, Germany. He studied biology with a focus on biochemistry and cell biology at the University of Bonn before specializing in pharmaceutical sciences and drug interactions in his doctoral studies. During his time in the pharmaceutical department, Dr. Mangold gained expertise in protein sciences, binding and interaction studies, and enzyme kinetics as part of an interdisciplinary team of chemists, pharmacists and biologists. Since 2021, Dr. Mangold has been part of the BMG LABTECH team where he authors application notes, performs training courses and supports scientific customers.
Enzymatic reactions, protein-protein binding, DNA replication, or receptor-ligand interactions are just a few examples of biological processes that depend on the proximity and binding affinity of two binding partners. Binding affinity measurements are central to molecular biology and drug discovery, as they help explain how biomolecules interact and function.
Drugs are often specifically designed to target binding interactions since they may be associated with specific diseases. In pharmaceutical research and drug discovery, the determination and optimisation of binding affinity are therefore important for the development of new drugs and treatment options.
Binding affinity is the strength of a binding interaction between a biomolecule and its ligand or binding partner. This intermolecular association is often facilitated by non-covalent interactions such as hydrogen bonding, electrostatic interactions, hydrophobic and Van der Waals forces. Binding affinity is determined not only by these direct interactions but also by factors such as protein conformation, which can stabilize specific states and influence ligand binding.
The compatibility of binding partners is not restricted to a single class of biomolecules. It depends more on their overall molecular and three-dimensional structures. The characteristics of the binding pocket and the protein conformation can significantly influence binding affinity by modulating how well a ligand is accommodated and stabilized within the protein.
In this way, binding can be achieved between many diverse biomolecules such as proteins, nucleic acids, hormones or second messengers.
Binding affinity plays an important role in basic research, medicine and drug discovery 1,2,3. It finds many uses including the determination of the binding characteristics of antibodies, nucleic acids or proteins, the characterisation of substrates and inhibitors, and the discovery of novel endogenous interaction partners. In drug research, it is used as a measure of the quality of a drug candidate. Knowledge of the affinity of a potential drug to its target structure makes it possible to draw conclusions on its selectivity, potency, and optimal dosage. In general, a higher affinity of a drug to its target is preferred since lower amounts of the drug are sufficient to induce the desired effect and may reduce the risk of adverse side effects. Tight binding and slow dissociation rates (low koff) can result in longer therapeutic effects and enable less frequent dosing. High-affinity drugs often employ specialized mechanisms that reduce off-target toxicity, and high-affinity ligands may remain effective against mutations that cause drug resistance.
Typically, binding affinity is represented by the equilibrium dissociation constant KD, the concentration of ligand at which half the binding sites on a biomolecule are occupied at equilibrium. The KD value describes how tightly two molecules bind to each other. For a simple reaction, a complex BL can dissociate into its original components B and L, the biomolecule and its binding partner or ligand, respectively. The larger the binding affinity of the ligand L to its target B, the more tightly bound they are together in the complex BL. Accordingly, a low KD value is associated with a high binding affinity and a high KD value is associated with a low binding affinity.
Since binding is not static and changes over time, binding affinity is determined by binding kinetics, which involves both the association and dissociation rate constants. Determining binding affinity accurately requires consideration of both binding and dissociation rates, as these kinetic parameters influence the stability and strength of the protein-ligand complex.
The association (KA) and dissociation constants (KD) are inversely related and can be calculated using the rate constants kon and koff. In the equilibrium reaction of complex formation and dissociation, kon is the rate at which the complex BL is formed from biomolecule B and ligand L. As such, it depends on the concentrations of B and L as well as time, and its units of measurement are molar per second (M-1 s-1). Conversely, koff, the rate at which complex BL dissociates into B and L, is independent of concentration and the units of measurement are per second (s-1).
 The dissociation constant KD can be calculated by dividing koff by kon. As it represents a ligand concentration, it is expressed in units of molarity (M). Alternatively, KD values can also be calculated from the concentrations of biomolecule B, ligand L and complex BL at equilibrium.
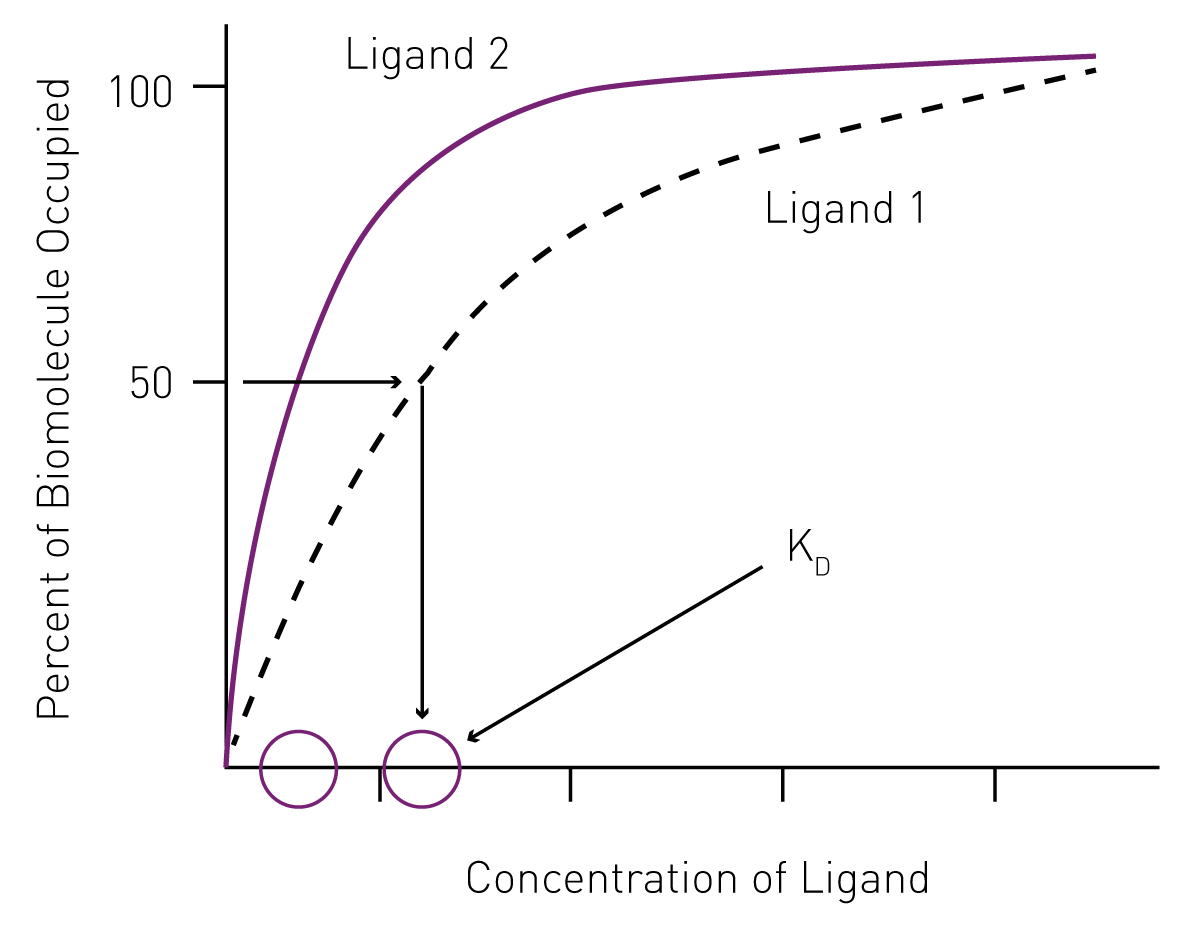
 The use of saturation curves to determine KD ligand binding affinity
In addition to mathematical equations, KD can be determined by non-linear regression from saturation curves. Since it represents the concentration of ligand at which half the ligand-binding sites of a biomolecule are occupied at equilibrium, KD values can be derived from saturation binding graphs by plotting the percentage of occupied biomolecule versus the ligand concentration (Fig. 1).
Alternatively, KD values can be determined by competition binding assays. Here, an untagged ligand is added at increasing concentrations to the target biomolecule that was previously treated with a known and tagged reagent. The untagged ligand of interest displaces the tagged reagent in a competitive reaction with the target that results in a signal decrease. This decrease in signal reflects the binding affinity of the ligand to the target biomolecule. The KD value of the untagged ligand of interest can be calculated from its IC50 value using the Cheng-Prusoff equation: 4
 Where IC50 is the amount of untagged ligand that displaces 50% of tagged reagent from the target biomolecule, [T] is the concentration of tagged reagent, and KDT is the equilibrium dissociation constant of the tagged reagent and target biomolecule complex.
Microplate readers are an essential tool for binding affinity-related research.
They offer different throughput options, use smaller volumes of sample and allow different conditions to be tested in one run. Microplate readers are ideally suited for the determination of binding affinity and the identification of interaction partners and potential drugs in high-throughput screening. Additionally, microplate readers deliver robust and reproducible results and can easily be integrated into automated systems, which makes them ideal platforms for use in high-throughput facilities.
High-quality binding data generated from microplate-based assays are critical for training and validating binding affinity prediction models, and the use of independent experiments helps ensure the robustness and accuracy of experimental findings.
Many binding assays are available to investigate binding affinity. The most relevant microplate-based measurement techniques used to determine binding affinity are described below. These employ the full range of detection modes, including absorbance, AlphaScreen®, fluorescence intensity, time-resolved fluorescence (incl. TR-FRET) and fluorescence polarization to luminescence.
FRET (Förster´s resonance energy transfer) is a detection technology that involves the energy transfer between two fluorophores: a donor and an acceptor. One fluorophore is attached to one of the interaction partners and the other fluorophore is attached to the second interaction partner. FRET is used to study the molecular interaction of the labelled partner molecules. In most cases, genetically encoded fluorescent proteins such as green, red, or yellow fluorescent protein are used as so-called “FRET pairs” to provide donor and acceptor fluorophores.
FRET is named after the German scientist Theodor Förster who originally developed the theory of resonance energy transfer 5. If FRET is to take place, the donor fluorophore that has absorbed energy upon external excitation and finds itself in an electronically excited state must transfer energy to the acceptor fluorophore, which can only happen if it is in close proximity (Fig. 2). The transfer of energy reduces the emission intensity of the donor while increasing the acceptor’s emission intensity which serves as a readout of the assay. Accordingly, two separate emission channels are needed to monitor donor and acceptor emission simultaneously.
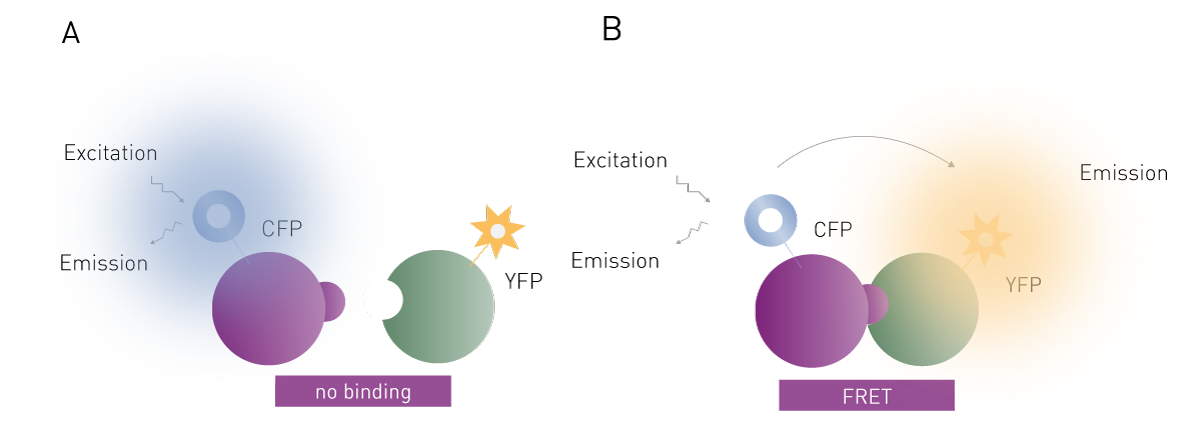
Since the acceptor fluorophore only emits a signal if the binding between the two interaction partners occurs, FRET can be used to investigate their interaction and binding affinity. FRET assays are particularly valuable for capturing the dynamics of the binding event and providing insights into the ligand binding site, which are critical for understanding protein-ligand interactions. In this context, FRET assay systems are often used to screen for new drug candidates.
In general, a competitive setup is used to avoid the need to label large numbers of potential inhibitors prior to screening. Here, the corresponding target structures are labelled with fluorophores rather than the potential inhibitors: a target bearing the donor and a known target binder bearing the acceptor molecule. If a compound displaces the acceptor-labelled molecule, the acceptor signal decreases due to separation, which indicates inhibition of binding. Binding affinity can then be determined from the ratio of acceptor to donor emission. In this way, large compound libraries can be screened for binding affinities to target biomolecules in a fast and efficient manner.
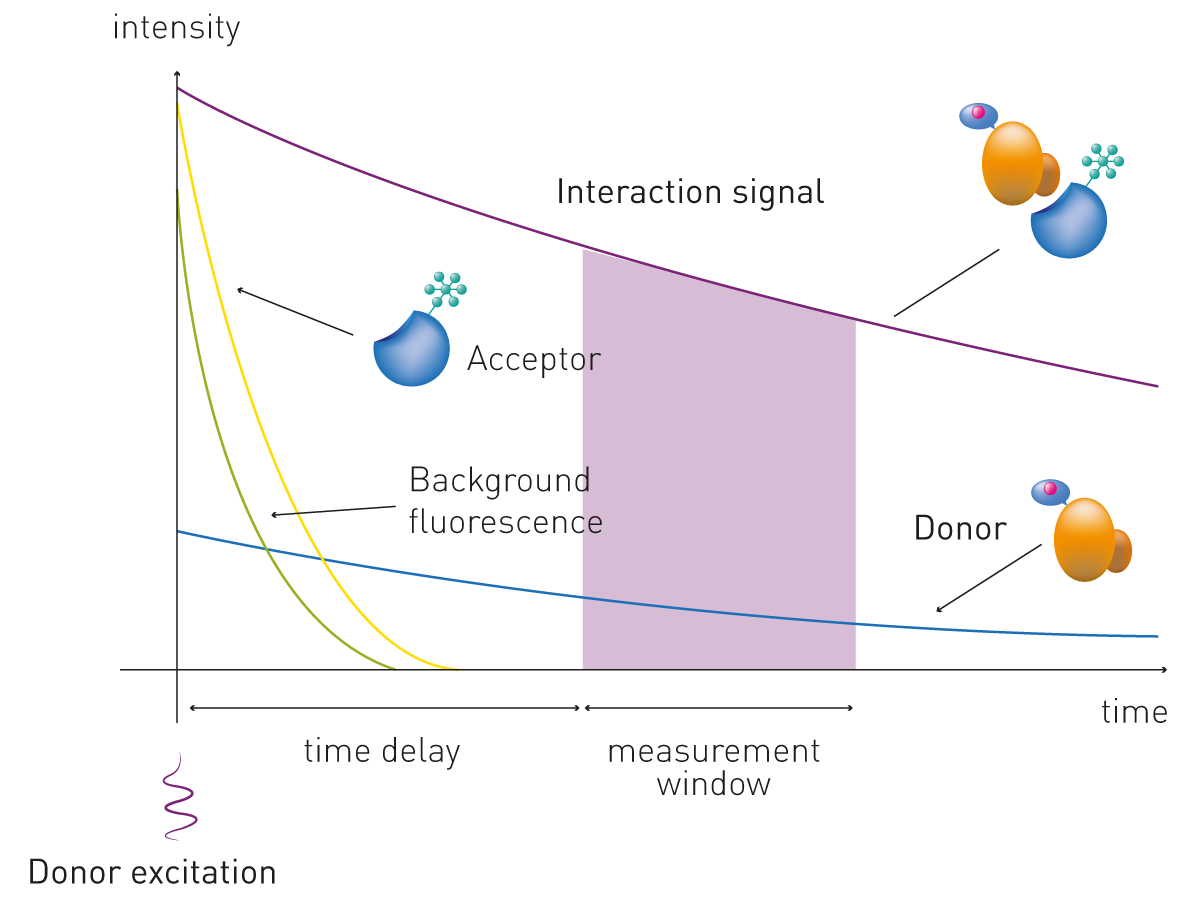
Time-resolved FRET (TR-FRET) improves the FRET detection technology by introducing time-resolved fluorescence (TRF) and time-delayed detection. This method eliminates the short-lived background noise which can derive from scattered excitation light and autofluorescence by employing lanthanides as donor molecules.
These long-lived fluorophores have large Stokes shifts, the differences in energy or wavelength between the absorbed light and the emitted light, and emission lifetimes up to milliseconds in length (compared to microseconds of classical fluorophores). These features enable the application of a time delay between excitation and fluorescence detection in the microsecond range. In this way, interference from buffer or growth medium is significantly reduced by the long-lived fluorescence emission of the lanthanides and by the ratiometric detection of the two emission wavelengths of donor and acceptor (Fig. 3). These distinctive features of TR-FRET offer improved stability and specificity over standard FRET and make TR-FRET easily adapted for cell-based assays and/or high-throughput screenings. TR-FRET is commonly used to study ligand binding to targets such as G protein coupled receptors, making it a valuable tool in receptor pharmacology and drug discovery.
The general principle of how this technology is applied is very similar for the kits available from different manufacturers, the most popular of which include HTRF®, LANCE® and LanthaScreenTM. Donor and acceptor are covalently bound to the interacting partners. Alternatively, a specific antibody against each of the two targets (or tags) is labelled with either the donor or the acceptor.
time-delayed detection. Homogeneous assays like TR-FRET do not need in-between washing steps and can be run as simple add-and-read assays, minimising handling steps, saving time and offering more convenience than ELISAs. Accordingly, TR-FRET can easily be adapted for high-throughput analysis of protein aggregation or protein-protein interactions. Further information and examples of these types of measurements are available in the following application notes: AN 286: Detection of human tau protein aggregation, AN 335: Analyze binding kinetics with HTRF and AN 388: Differential binding of ∆9-tetrahydrocannabinol derivatives to type 1 cannabinoid receptors (CB1).
In his testimonial, Pioneering Pre-Clinical Drug Discovery with Advanced Assays, Nick Holliday from Excellerate Bioscience and the University of Nottingham discusses the benefits of the PHERAstar FSX for TR-FRET-based kinetic binding analysis.

Fluorescence polarization (FP) is a fluorescence-based detection method that is widely used to investigate molecular interactions and binding affinity in solution. However, unlike fluorescence intensity, FP does not solely focus on the emission wavelength of a fluorophore upon excitation but also involves the analysis of the polarization of the emitted light.
As an electromagnetic wave, the electric field of light oscillates perpendicularly to the direction of propagation, which determines its polarization. In the case of unpolarized light, the direction of this oscillation fluctuates randomly over time. The oscillation can be selected using specific filters to produce plane-polarized light where all the selected light waves oscillate in a single plane (Fig. 4).
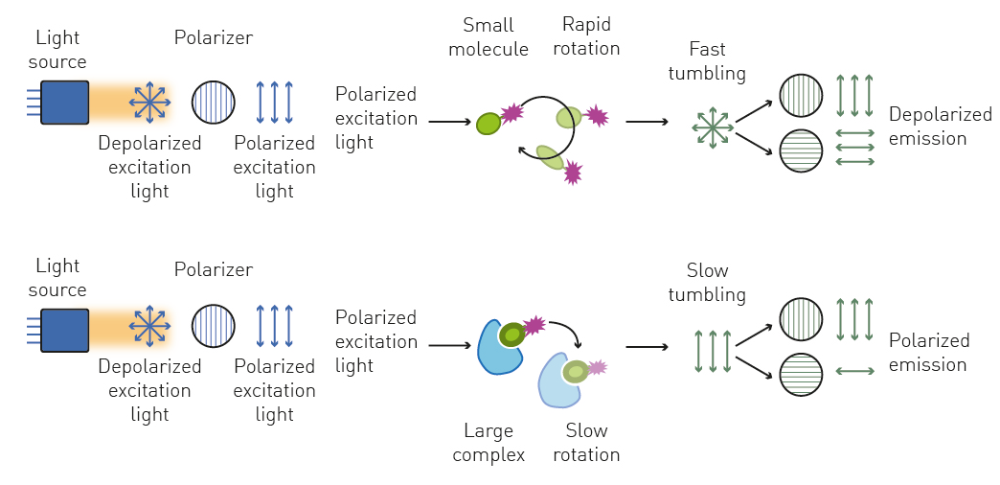
FP can be used to analyse molecular interactions and to determine binding affinity by performing binding kinetics. Alternatively, dissociation and enzymatic degradation assays can be measured with FP using the decrease in molecular size and subsequent increase in depolarized light as readout.
Using this principle, the interaction of transcription factor p53 with different DNA sequences was quantified by employing p53, fluorescently labelled DNA and competitor DNA sequences without an attached fluorophore. In titration experiments, the competitor DNA displaced the labelled DNA from p53 and the subsequent change in FP of labelled DNA was used to calculate the dissociation constant KD. You will find more information on this topic in AN 180: High-throughput protein DNA measurement using fluorescence anisotropy. See also AN 256: Protein-ligand binding measurements using fluorescence polarization.
Fluorescence polarization is also well suited to study binding kinetics during ligand receptor interaction. In contrast to classically used assays based on (TR-)FRET- or BRET, FP-based assays do not require additional labelling of the receptor next to the ligand. This application note shows the successful application of a Competition assay using Fluorescence Polarisation to determine the Residence Times for Calcitonin and AMYR agonist, AM833.
In the AppNote “Studying the molecular basis of antibiotic resistance by assessing penicillin interaction with PBP5 using fluorescence polarization” a fluorescent penicillin derivate was used to monitor the interaction of penicillin with different variants of the penicillin binding protein 5, a protein responsible for the cross-linking of the bacterial cell wall.
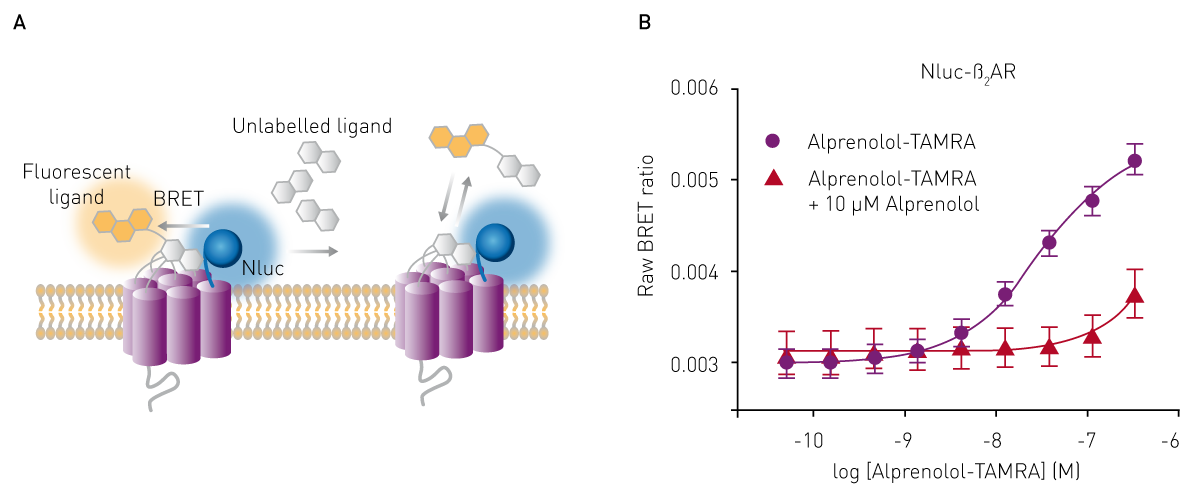
BRET (bioluminescence resonance energy transfer) assays are luminescence-based methods that can be used to determine binding affinity and are often employed to investigate protein-protein interactions. Like FRET, they are based on resonance energy transfer, but in the case of BRET, the donor energy is generated by bioluminescence with one interaction partner coupled to luciferase and the other to an acceptor fluorophore. Upon interaction of both partners, the luminescence energy produced by the luciferase is transferred to the acceptor molecule and the acceptor emission can be measured with a luminescence plate reader or with a multi-mode plate reader (fig. 5 A).
The binding affinity of a ligand to its interaction partner can be determined by saturation or competition binding assays from the raw BRET ratios of acceptor to donor emission (Fig. 5 B). For this purpose, researchers at Promega developed a genetically engineered luciferase called NanoLuc® (Nluc), which is ideally suited to act as BRET donor due to its small size and high stability 6. See also: AN 287: NanoBRET assay for monitoring of ligand binding to GPCRs in live cells, using the CLARIOstar and the PHERAstar FS. Novel approaches using the NanoBIT® system, which employs a fragmented nanoluciferase attached to two binding partners of interest, are frequently used nowadays. Upon binding, the nanoluciferase fragments form a functional enzyme that can generate a luminescence signal as highlighted in the application note: Identification of androgen-disruptors using a cell-based androgen receptor dimerization assay.
AlphaScreen® (ALPHA for Amplified Luminescent Proximity Homogenous Assay) uses bead-based chemistry to study intermolecular interactions. For this purpose, ligand and target biomolecules are labelled with either of two types of hydrogel-coated beads, called the donor or acceptor beads.
AlphaScreen donor beads contain a photosensitizer that converts oxygen (O2) into excited singlet oxygen (1O2) upon excitation at 680 nm. In turn, 1O2 reacts with chemical dyes in the acceptor beads. The transfer of chemical energy results in broad light emission from 520 nm to 620 nm which can be measured with a microplate reader.
Due to the short half-life time of excited 1O2 (4 µs), energy transfer and chemiluminescence can only occur if both types of beads are in close proximity to each other (less than 200 nm). Accordingly, AlphaScreen assays are perfectly suited to monitor the interaction of potential binding partners.
AlphaScreen technology, which includes AlphaScreen, AlphaLISA® and AlphaPlex™ assays, is mainly used in high-throughput screening to assess biomolecular interactions due to its very high sensitivity. Employing this principle, Christott et al. used an AlphaScreen assay to screen for selective inhibitors of the human YEATS domain and determined their binding affinity by analysing dose-response curves and IC50 values. For more information see AN 320: PHERAstar measures AlphaScreen assay to develop selective inhibitors for the human YEATS domains.
While methods based on FRET, FP, BRET and AlphaScreen are most often used in binding studies, there are also some assays that utilize absorbance as a readout to investigate molecular interaction and binding affinity. These assays are based on the quantification of an absorbance signal or the change in this signal over time.
For example, competitive ELISA assays can be employed to determine the binding affinity of antibody pairs. However, the often-heterogeneous principle of these kinds of assays limits their application in an automated high-throughput setting, since additional washing and handling steps are needed compared with homogeneous BRET, FRET, TR-FRET or FP applications.
Modern microplate readers offer several advantages for the determination of binding affinity and interaction assays such as increased performance and sensitivity. They deliver robust results, coupled with minimal variability and larger assay windows. Features such as Simultaneous Dual Emission, Decay Curve Monitoring, Enhanced Dynamic Range and the improved detection of fluorophores in the red range help to further reduce background signals and measurement time while improving sensitivity.
Furthermore, microplate readers are the perfect platform for the high-throughput screening of molecular interactions, protein-protein binding, and drug interactions. Homogenous interaction assays such as FRET, TR-FRET, FP, BRET and AlphaScreen-based methods do not require washing steps to remove unbound components from an assay and are based on a mix and read principle. This can minimise both handling steps and operation time, which makes them particularly useful in automation-supported screening and in drug discovery. For a deeper understanding check also our blog post Binding constants on a microplate reader.
Powerful and most sensitive HTS plate reader
Most flexible Plate Reader for Assay Development
Flexible microplate reader with simplified workflows
Binding constants quantify the strength of a binding reaction between a biomolecule and its target (ligand). But how do you measure them and what can you do with them?
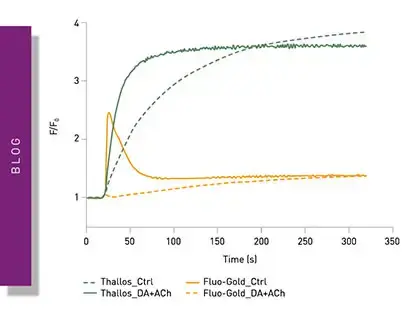
Receptor-ligand kinetics is the study of the rates at which receptors and ligands interact, bind and dissociate. Learn why these types of measurements are important and how to measure them.
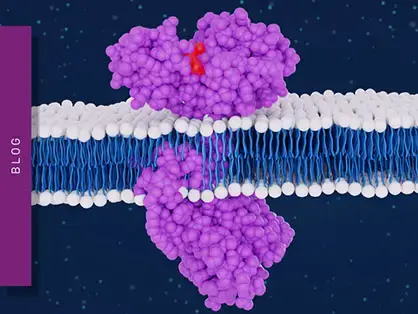
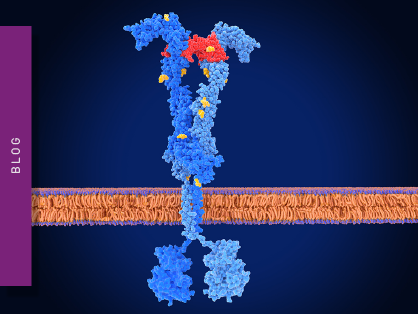
Receptor-ligand interactions are crucial for cell signalling. They are also important for drug discovery. How do microplate readers deliver benefits to both?
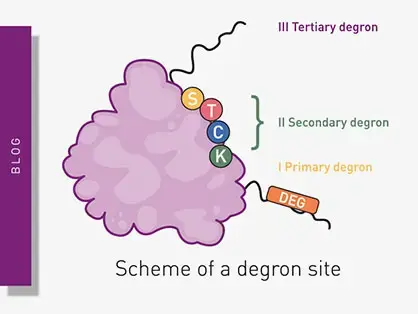
Degrons are specific sequences of amino acids or structural motifs within a protein that are important for targeted protein degradation. Find out how microplate readers can advance research into natural and engineered degrons.
Gene reporter assays are sensitive and specific tools to study the regulation of gene expression. Learn about the different options available, their uses, and the benefits of running these types of assays on microplate readers.
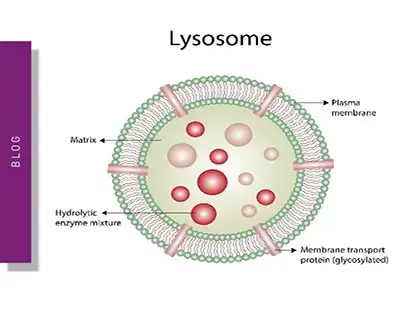
Innovation for targeted protein degradation and next-generation degraders is gathering pace. This blog introduces some of the different approaches that act via the lysosome or proteasome.