
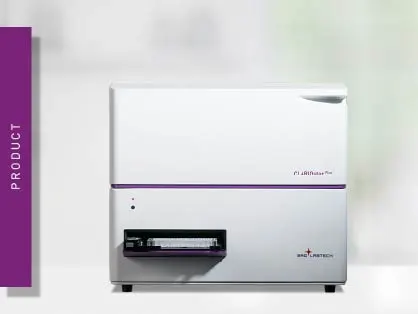
CLARIOstar Plus
Most flexible Plate Reader for Assay Development
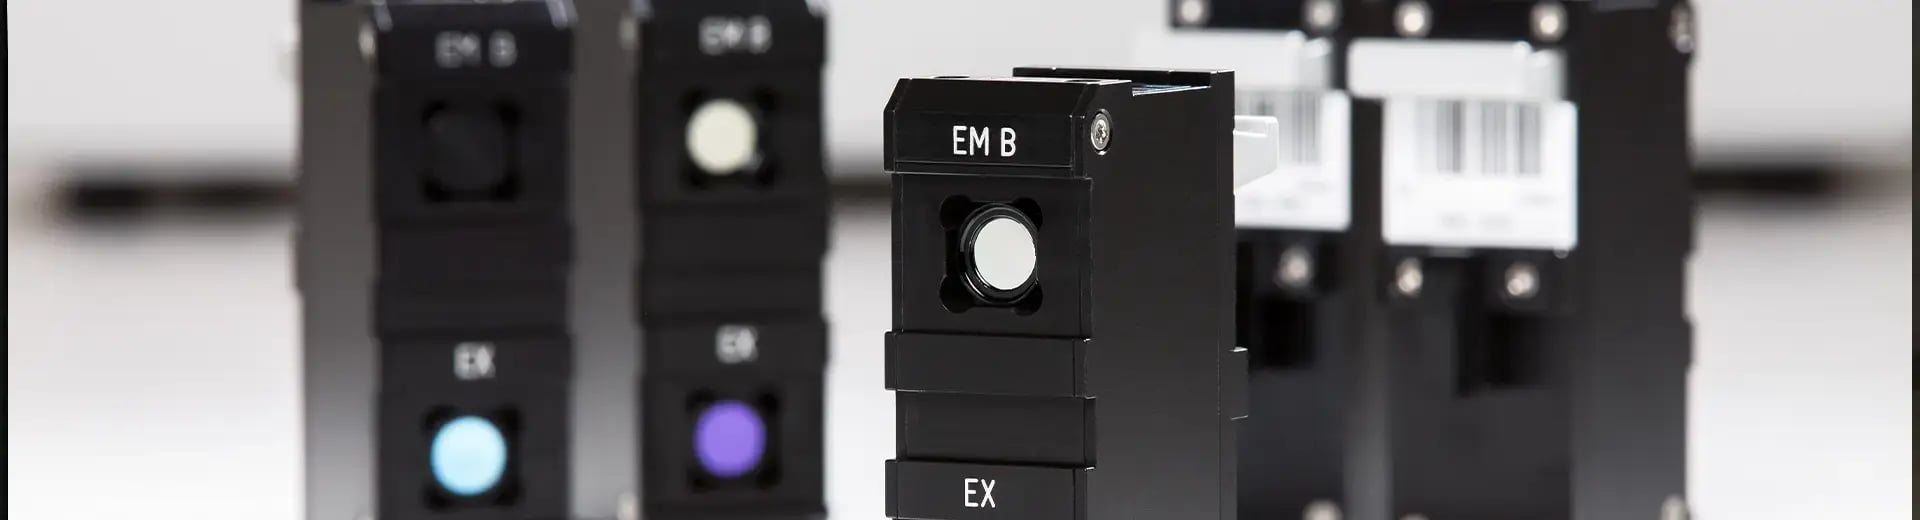
Fluorescence intensity is the amount of light emitted by a fluorescent substance after it absorbs light at a specific excitation wavelength. The emitted light is produced by fluorescent molecules called fluorophores (Fig. 1).
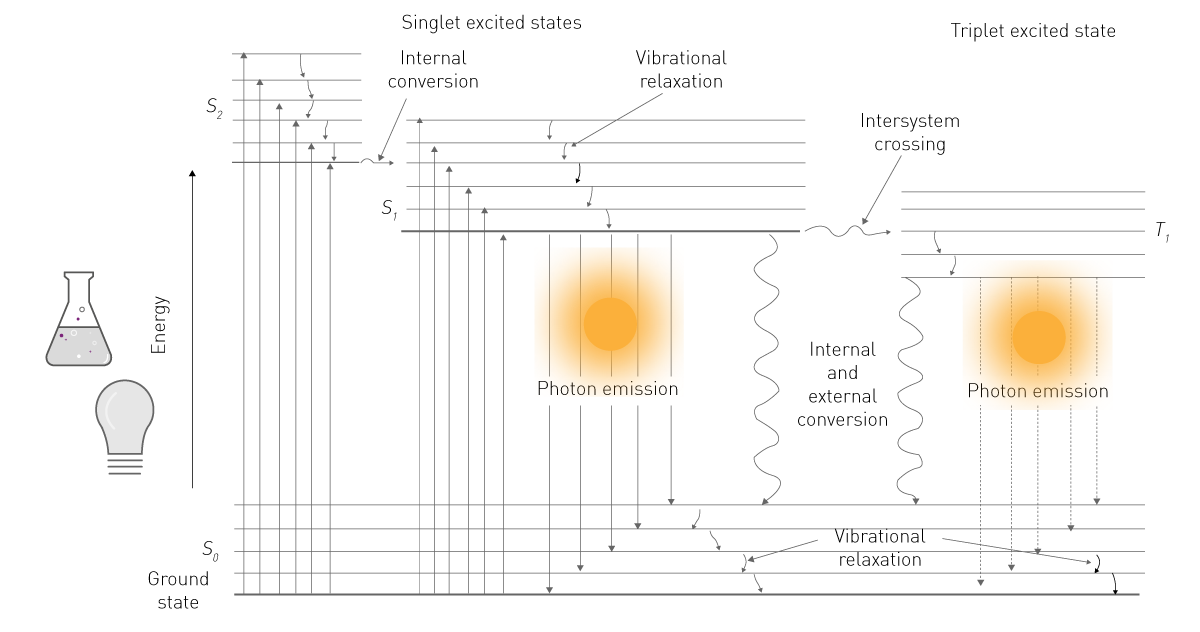
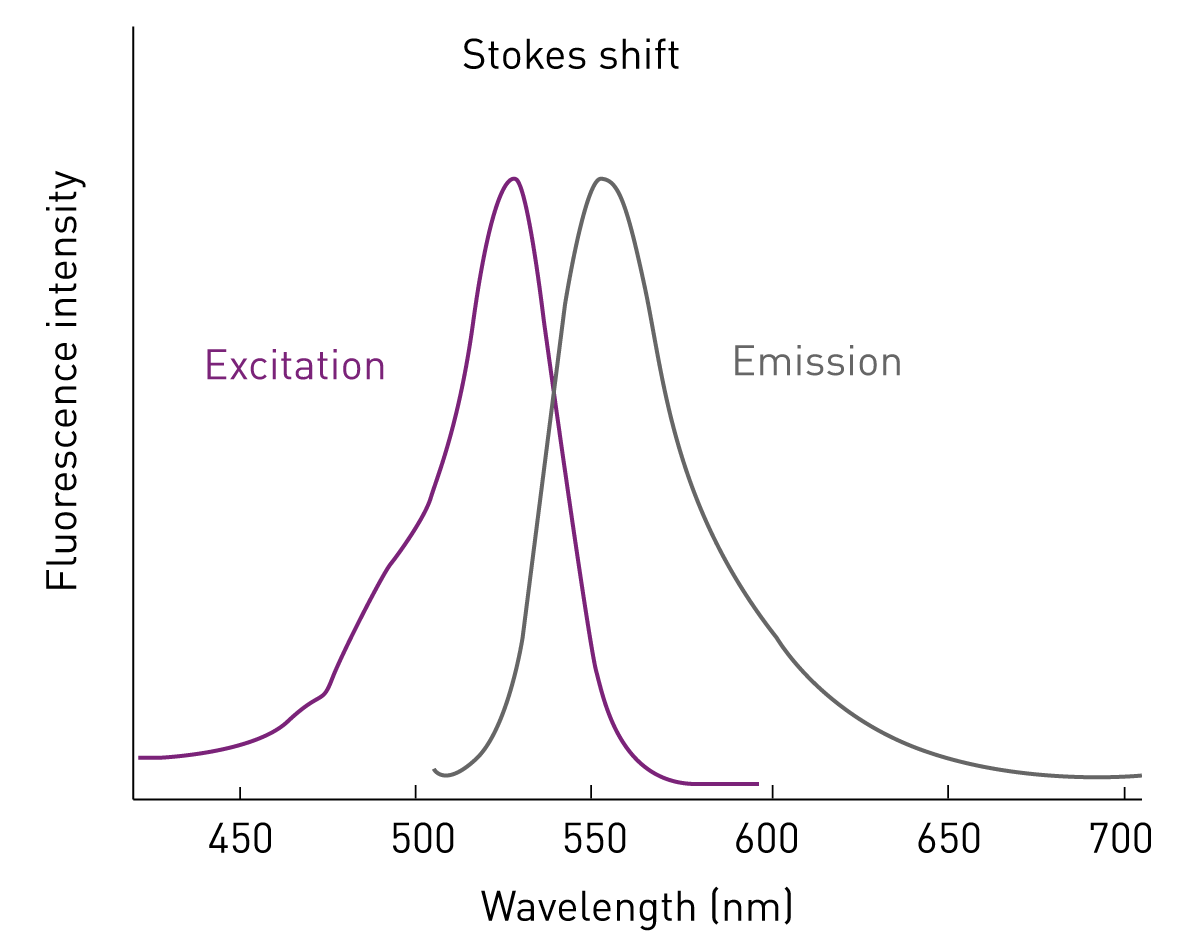
When a fluorophore absorbs light, its electrons move to a higher energy state. As the electrons return to their ground state, they release some of the absorbed energy as light. The emitted light usually has a longer wavelength than the excitation light. This difference is known as the Stokes shift (fig. 2).
In a suitable assay, fluorescence intensity can be related to the concentration of the fluorophore or analyte. This makes fluorescence measurements useful for quantitative analysis in applications such as cell viability testing, enzyme activity assays, nucleic acid quantification, protein studies, and drug discovery.
Fluorescence intensity measurements are commonly performed using microplate readers, fluorescence microscopes, and flow cytometers. This article focuses on fluorescence detection in microplate-based assays, including instrument configuration, measurement considerations, and common fluorescence assays.
Fluorophores are molecules that absorb light at one wavelength and emit light at another. Their optical properties determine how they perform in a fluorescent assay and influence the sensitivity, selectivity, and compatibility of a fluorescence detection method.
When selecting a fluorophore, consider:
Molecular size and compatibility with the biological target
Excitation and emission wavelengths
Quantum yield and brightness
Photostability
Compatibility with the sample matrix and detection instrument
Spectral overlap with other fluorophores or sources of autofluorescence
Many fluorophores are small chemical compounds that can be linked to proteins, nucleic acids, antibodies, or other molecules. Fluorescent proteins, such as green fluorescent protein (GFP) and red fluorescent protein (RFP), are larger fluorescent tags that can be expressed by living cells.
Fluorescent proteins can be used to monitor protein expression, study cellular processes, develop genetically encoded biosensors, or estimate cell number. For example, GFP and mCherry can be used to monitor transfection efficiency.
A fluorophore’s excitation and emission properties are shown using fluorescence spectra. Wavelength is plotted on the x-axis, usually in nanometres, while relative fluorescence intensity is plotted on the y-axis.
The spectra show the wavelengths at which the fluorophore absorbs and emits the most light. These maxima help determine the appropriate settings for a fluorescence assay.
When selecting a fluorophore, make sure its excitation and emission wavelengths are compatible with:
The filters or monochromators in the plate reader
The detector’s wavelength range
Potential autofluorescence from the sample or buffer
Other fluorophores used in multiplex fluorescence assays
The quantum yield is a measure of how efficiently an excited molecule converts absorbed photons into emission light. In combination with the extent to which light is absorbed (extinction coefficient), the quantum yield gives an indication of the brightness of a fluorophore.
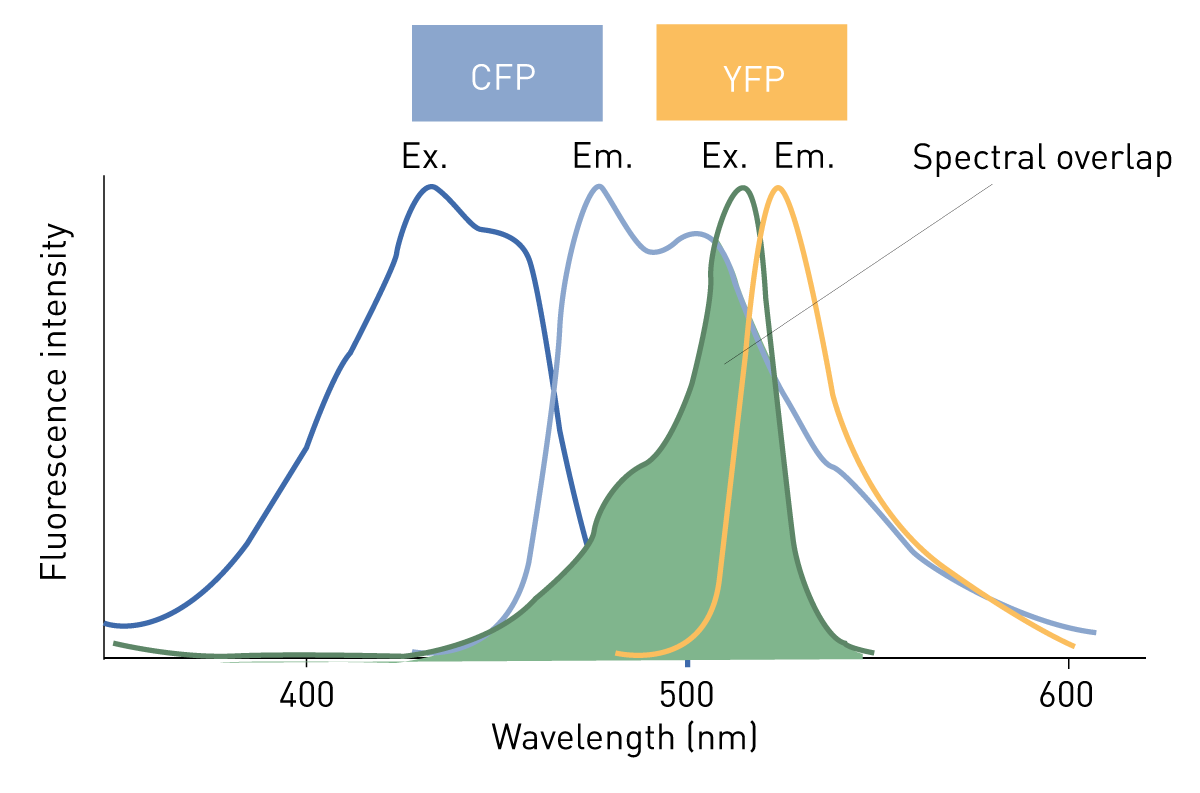
Förster resonance energy transfer (FRET) describes the transfer of energy from a donor fluorophore to an acceptor fluorophore. The donor and acceptor must be sufficiently close for energy transfer to occur.
FRET assays are used to study molecular binding, conformational changes, receptor-ligand interactions, and biosensor responses. For FRET to occur, the donor emission spectrum must overlap with the acceptor excitation spectrum.
In a FRET biosensor, binding of an analyte can change the distance or orientation between the donor and acceptor. This produces a measurable change in fluorescence intensity or in the ratio between donor and acceptor fluorescence.3
Even though fluorophores differ from each other, the basis of fluorescence intensity measurements in microplates is the same (fig. 4):
As opposed to absorbance, fluorescence is not an absolute measurement. The intensity of the fluorescent signal is usually relative to other measurements or to a reference measurement taken by an instrument. Consequently, fluorescence plate readers measure the light signal emitted by a sample in Relative Fluorescent Units (RFU).
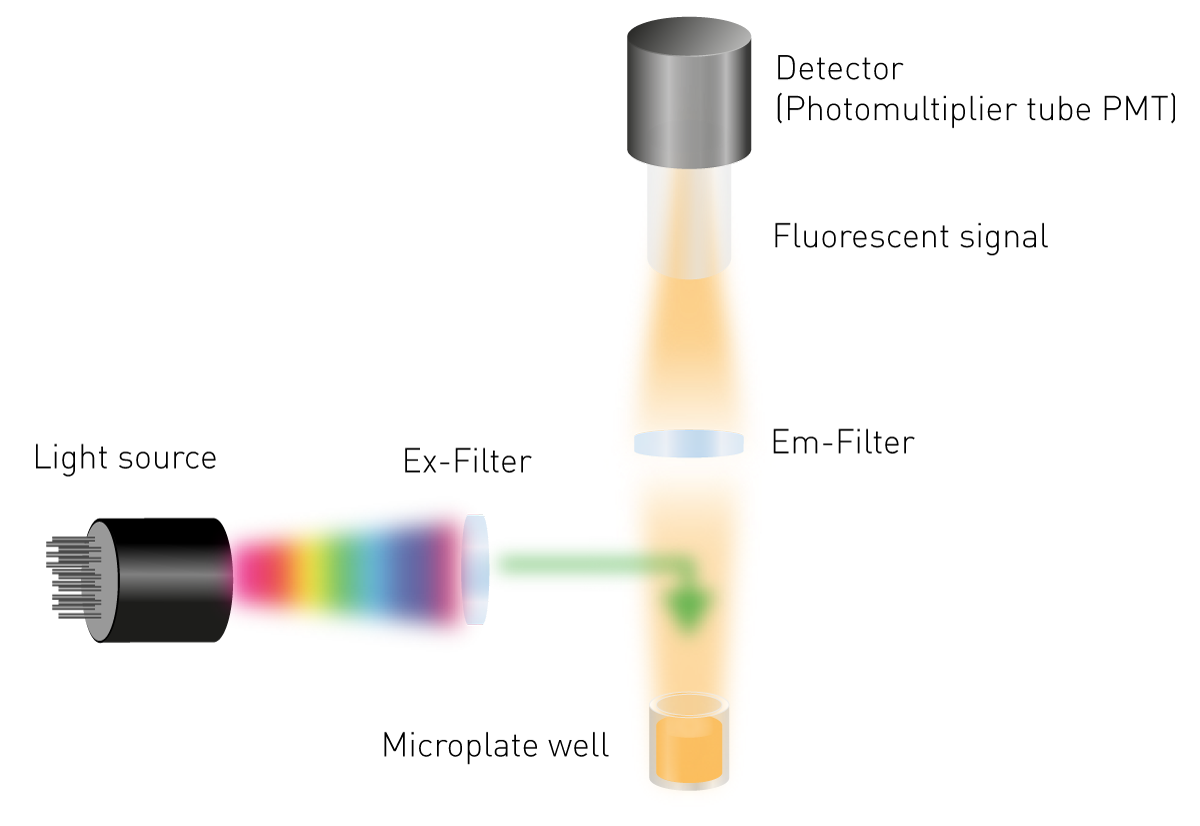
The light source affects the available excitation wavelengths, signal strength, measurement speed, and instrument lifetime. Common light sources in microplate readers include xenon flash lamps, tungsten-halogen lamps, and light-emitting diodes. Read more in the HowTo Note: How does the number of flashes influence measurement results?
Xenon flash lamps produce a broad spectrum of light in the range of 200 nm to 2500 nm and can support fluorescence detection in the UV range to the infrared range. They exhibit a high signal output and are long-lived. Because of these advantages, xenon flash lamps are used as fluorescence excitation sources in BMG LABTECH plate readers.
Halogen lamps emit light starting from approximately 360 nm and are unsuited to measure UV fluorescence intensity. In comparison xenon lamps, tungsten lamps have a shorter lifetime, a lower output intensity, and result in lower sensitivity, if used in microplate reader fluorescence detection.
Light Emitting Diodes (LEDs) emit light with high intensity but only at a specific bandwidth. Accordingly, multiple diodes are required for different excitation wavelengths, making flexible detection of multiple fluorophores more complicated and expensive.
Selecting suitable excitation and emission wavelengths is essential for sensitive fluorescence detection. The excitation wavelength should efficiently excite the fluorophore, while the emission range should capture the emitted light and minimise the amount of excitation light reaching the detector. Fore more information read the Howto Note: Wavelength and bandwidth optimisation on a microplate reader.
The sensitivity of detection in some fluorescence intensity microplate readers is enhanced by the use of an additional selection between excitation and emission: a dichroic mirror. The dichroic mirror typically transmits light higher than a specific wavelength but blocks light at lower wavelengths. The cut-off lies between excitation and emission and provides lower leak-through of excitation light to the detector.
Optical filters transmit a defined range of wavelengths and block most of the remaining light. A filter is often described by its centre wavelength and bandwidth.
For example, a 485 nm filter with a 10 nm bandwidth may transmit wavelengths from approximately 480 to 490 nm. The exact transmission range depends on the filter specification.
The excitation and emission filters should be selected using the fluorophore’s spectra and the requirements of the fluorescent assay. Filter choice should also account for autofluorescence, spectral overlap, and the sensitivity of the detector.
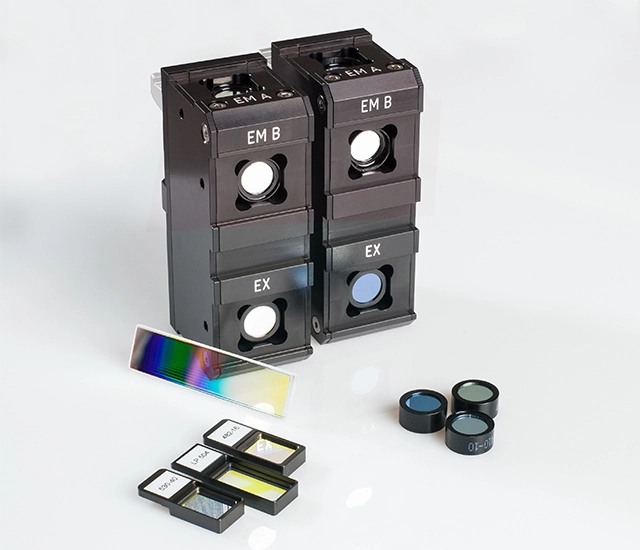
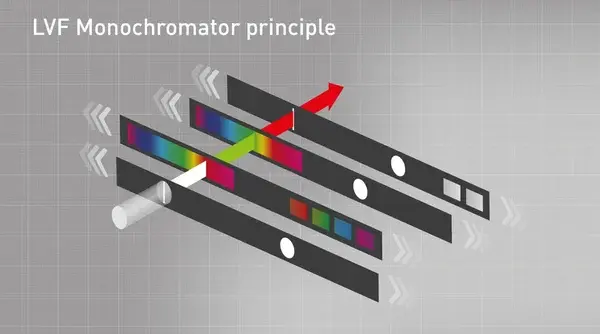
Unlike fixed optical filters, monochromators can select different wavelengths according to the measurement requirements. Microplate readers may use grating-based monochromators or Linear Variable Filter (LVF) monochromators.
Grating-based monochromators separate broadband light by diffraction. A slit then selects the required wavelength range. However, light transmission can be lower than with some filter-based systems, and stray light may reduce fluorescence sensitivity.
Linear Variable Filter (LVF) Monochromator use filters with a continuously varying transmission profile. By positioning the filters appropriately, the instrument can select different wavelengths and bandwidths without dispersing the light into separate colours. The use of Linear Variable Filters in microplate readers is a patented technology by BMG LABTECH.
Fluorescence intensity in microplate readers is detected with photomultiplier tubes (PMTs). They multiply the signal using the photoelectric effect and convert the light into an electric signal. For fluorescence intensity measurements in microplate readers, two different PMTs are used, which differ in their sensitive wavelength range. A low-noise blue/green PMT is sensitive in the range up to 740 nm and is often also used for luminescence measurements. A red-shifted PMT measures the fluorescence sensitively up to 900 nm and thus also covers red and infrared dyes. These are often used for cell-based measurements since the autofluorescence is reduced in this wavelength range.
The performance of a fluorescence assay depends on both the assay chemistry and the measurement settings. Plate type, optical configuration, gain, focal height, wavelength selection, incubation conditions, and measurement timing can all affect the fluorescence signal.
Black microplates are generally preferred for fluorescence assays because they reduce reflection and the spread of excitation and emission light between wells. More details on the plate choice are found in our blog post "The microplate: utility in practice."
Choosing the right filter is essential for a precise fluorescence intensity determination. As already mentioned, the mean wavelengths should be at or close to the excitation and emission maximum. However, there are a few things to keep in mind:
If the edges of excitation and emission filters are too close to each other, the excitation light may leak through and reach the detector. Then the signal of the fluorophore disappears in the excitation light and is no longer measurable. How close the filters can be, depends on the quality of the filters and on the use of a dichroic mirror. Typically, the highest transmitted excitation and the lowest transmitted emission wavelengths should be 30 nm apart (fig. 7).
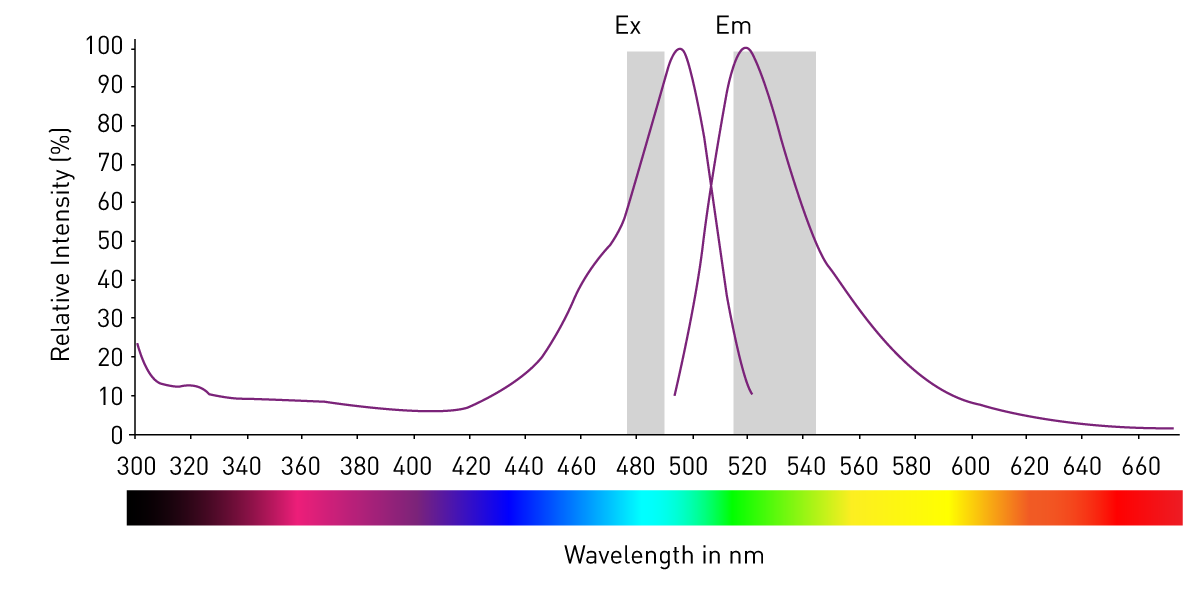
The bandpass of filters varies from a few nanometers up to 100 nm. The bandpass affects the amount of light that can pass the filter. Low bandwidth filters (~10nm) are recommended for bright fluorophores or for complex samples with high autofluorescence. A typical example is green fluorophores such as AlexaFluor488, FITC, or GFP in a cellular environment.
Broader bandwidth filters are recommended for low emission fluorophores if they emit in a range where autofluorescence is low (emission <600nm) or if the buffer contains no other fluorescent compound. BMG LABTECH selects the filters based on the fluorophore excitation and emission spectra. In addition, filter pairs are measured and matched to one another so that you can be sure that you are receiving the best possible filters. Default settings for common fluorophores are also already stored for the monochromator so that this selection work is not left to the researcher.
The above considerations also apply to FRET measurements. However, it must be noted that two emissions must be recorded separately. The excited donor fluorophore emits light at a specific wavelength if no acceptor is nearby. If an acceptor fluorophore is close, the donor transfers the energy to the acceptor which then emits light at a higher wavelength. This means that two emission filters are required, one of which only allows the donor emission and the other only the acceptor emission to be transmitted.
The fluorescence gain is an amplification factor, or more precisely, the voltage of the detector at which the incoming light signal is amplified. Changing the gain moves the dynamic range of detection along the concentration curve of the analyte/assay. However, the width of the dynamic range is fixed and does not change.
Weak signals need a large amplification (high gain), and bright signals need less amplification (small gain). An incorrectly selected gain can make measured data unusable because it either exceeds the measuring range or differences are no longer resolved. Data highlighting these effects can be found in the HowTo Note: How to optimise the gain setting of your microplate reader? The gain is typically set to have a maximum measurement output on the sample with the expected highest intensity. This is done in order to have the largest possible dynamic window between the highest and the lowest measurement values (fig. 8).
All BMG LABTECH microplate readers determine the gain automatically, provided a specific well with a specific signal intensity is identified. However, on the CLARIOstar Plus and VANTAstar, no gain adjustment is necessary. The Enhanced Dynamic Range (EDR) technology was specifically designed to offer the largest possible dynamic range - 8 concentration decades. This provides researchers with an unprecedented convenience in microplate measurements as highly reliable results can be measured over a large dynamic range with no manual intervention.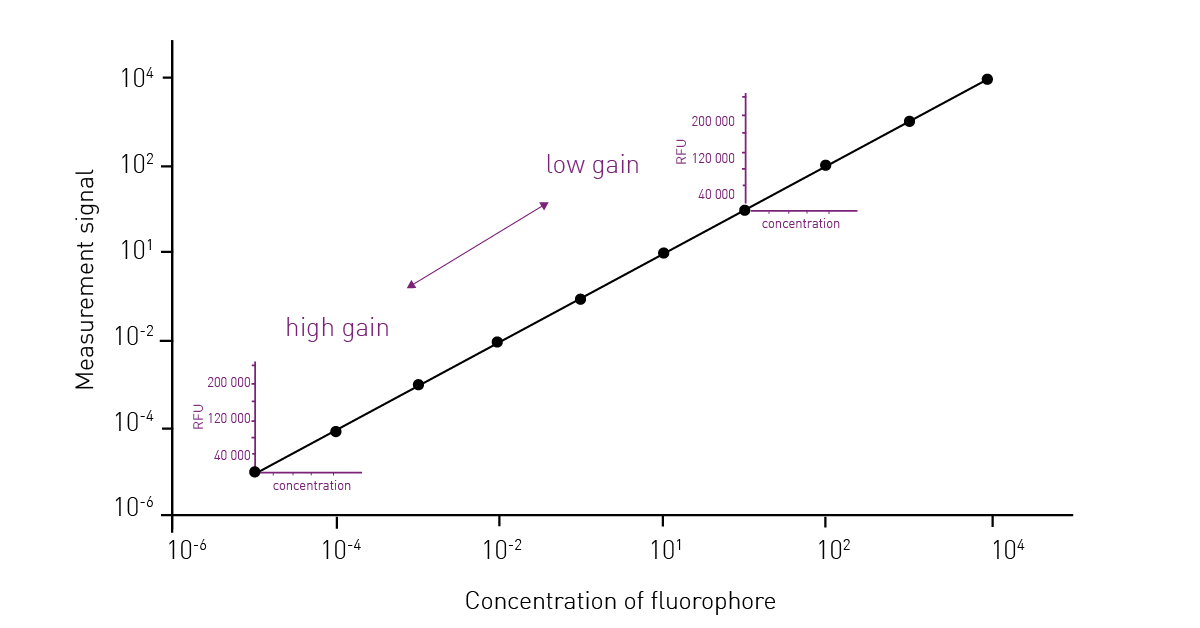
The height at which a signal is detected has a significant impact on the sensitivity of the measurement. Measuring at a suboptimal focal height may reduce the signal by up to 90 %. For instance, adherent fluorescent cells need to be measured close to the plate bottom, whereas a homogeneous fluorescent solution gives the highest signal just beneath the liquid surface and depends on the fill volume of the well. Some plate readers determine the optimal focal height in a selected well. The CLARIOstar® Plus and VANTAstar® also provide automatic focal-height optimisation and determine the focal height automatically while reading a plate.
Fluorescence assays use changes in fluorescence intensity to measure biological activity, molecular concentration, cellular responses, or interactions between biomolecules. The following examples show how fluorescence analysis is used in research and drug discovery.
Whether cells are harmed by a compound or cancer cells die upon treatment are common questions answered by fluorescent viability and cytotoxicity assays and microplate readers. In the alamarBlue™ assay, resazurin is reduced by metabolically active cells to a fluorophore and reports on cell viability. Another way to assess cell viability is the incorporation of fluorescently marked nucleosides into the DNA. These are incorporated and consequently fluoresce only if DNA replication takes place, a marker of viability.
A way to detect cell death by fluorescence intensity is based on fluorescent DNA dyes such as SYBR® Green or Celltox™ Green. The dyes are non-cell-permeable but get exposed to DNA in solution in case the cell membrane is disrupted during cell death and then starts to fluoresce (fig. 9). These assays are compatible with real-time measurements and can monitor cell health over time. As these measurements are done over days, the microplate chamber needs to be incubated at 37 °C and with 5 % CO2 to keep cells happy. The CLARIOstar Plus with Atmospheric Control Unit has proven to provide the ideal atmosphere for long-term cell-based experiments. More cell health assays are described in our blog post “Cell viability assays – Measure how happy your cells are”.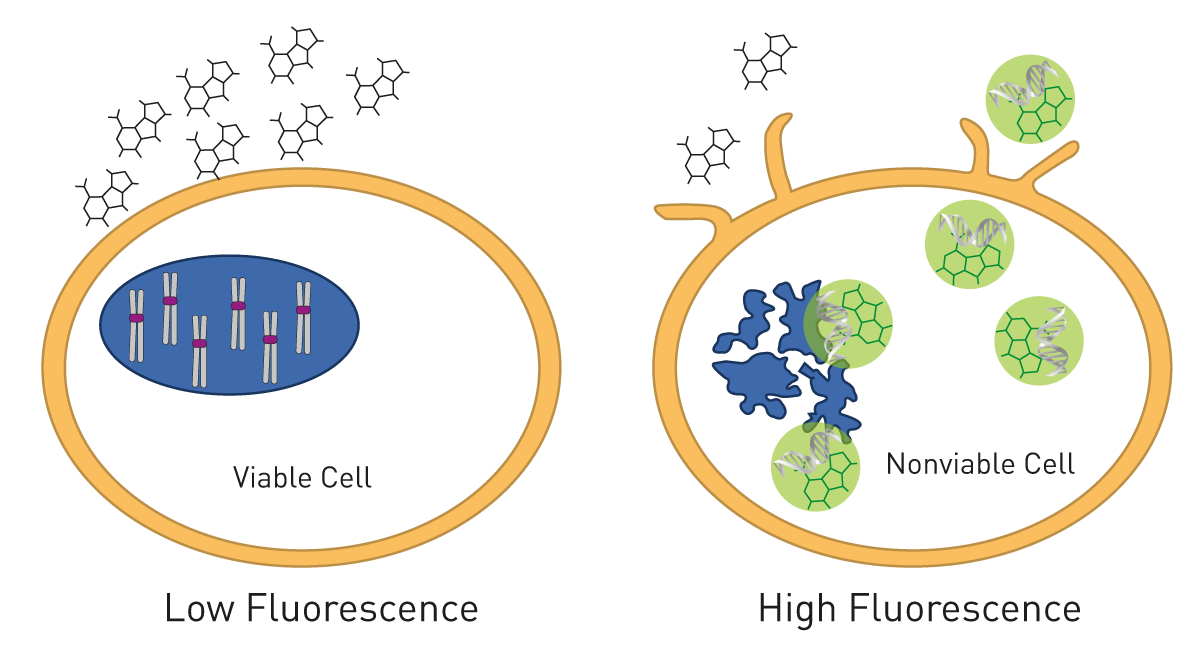
As enzymes are involved in multiple biological processes, it is important to study how inhibitors or promoters influence enzyme activities. The principles of enzyme assays are comparable: they employ a pre-fluorescent substrate which upon enzyme processing releases a fluorophore. Common fluorophores are based on coumarin derivatives such as in the fluorescence-based assay of the epigenetic enzyme histone deacetylase 1 (HDAC1), where they can be used to investigate inhibition of histone deacetylases.
A second fluorophore used in enzyme assays is 4-methylumbelliferone. An example is found in the application note “CLARIOstar determines activity of a moss-produced human acid alpha-glucosidase (GAA) in a fluorescence-based assay”. The CLARIOstar Plus multi-mode microplate reader makes fluorescent enzyme activity analysis easy. The Enhanced Dynamic Range technology allows reading over a dynamic range of 8 decades. This way, the increasing signal in enzyme activity assays is easily recorded without the risk of choosing a wrong gain or time-consuming instrument optimization. The instrument comes with a free-of-charge analysis software with integrated enzyme kinetic analysis covering Michaelis-Menten and Lineweaver-Burk modelling (Enzyme kinetic measurements performed on a BMG LABTECH microplate reader).
The fluorescence of naturally occurring amino acids like tryptophan can also be used to measure conformational changes and enzyme activity of proteins. Some examples of applications are described in our blog post Tryptophan fluorescence: nature’s probe. Tryptophan fluorescence is useful for example to screen for new therapeutics for drug targets like G-protein-coupled receptors, one of the most popular targets for approved drugs on the market today.
Proteins aggregate if they are misfolded and aggregation correlates with diseases such as Alzheimer’s, Parkinson’s, and prion disease. The analysis of the formation of molecular aggregates helps diagnose and understand these diseases, as well as test potential drugs. The two fluorophores bis-ANS and Thioflavin T (ThT) increase their fluorescence intensity upon interaction with protein aggregates. Bis-ANS preferably interacts with amorphous aggregates as described in the application note “Use of a BMG LABTECH microplate reader to monitor amyloid formation”.
ThT binds to fibrils and is mainly used in kinetic assays. If the sample contains aggregation-inducing molecules, the recombinant proteins aggregate, and fluorescence increases (fig. 10).
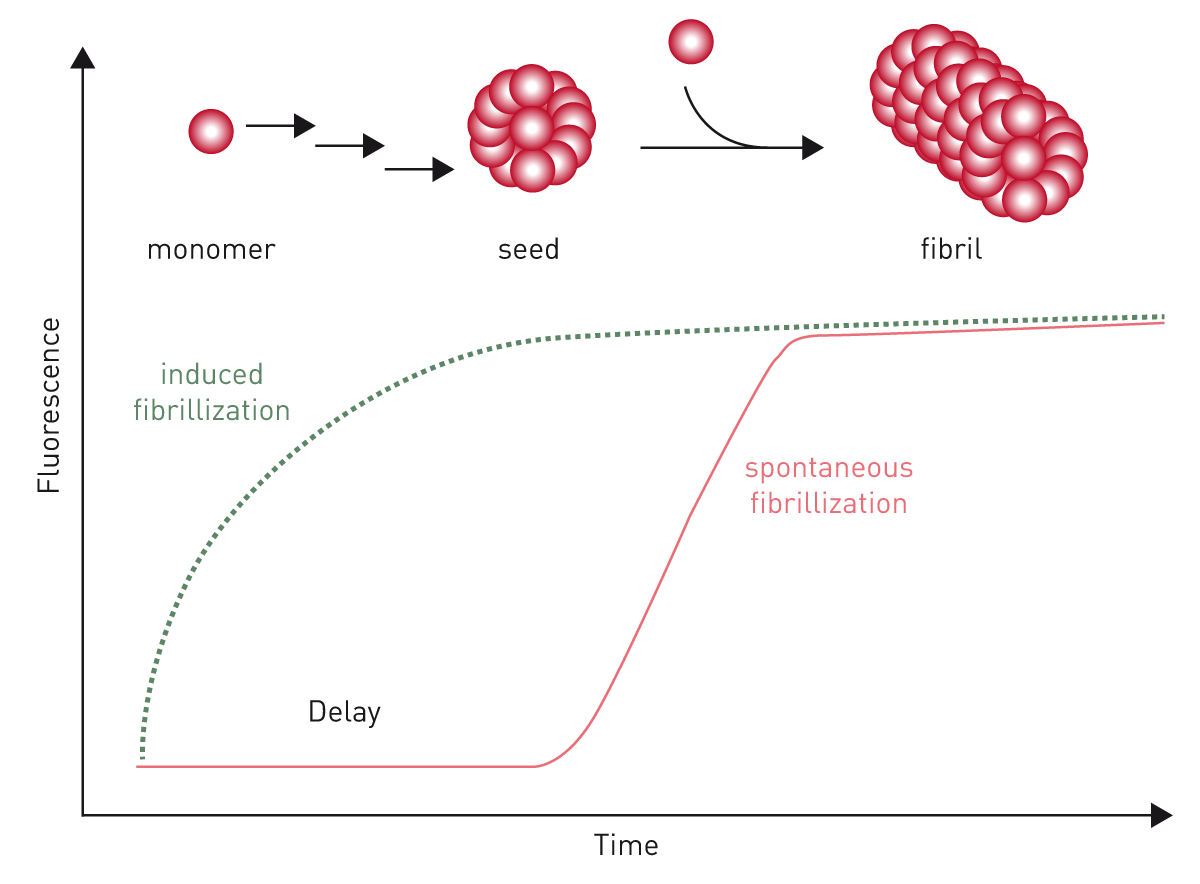
The application note “Real-time quaking-induced conversion assay for prion seeding” explains how the assay is used for detecting the prion diseases scrapie in hamster brain homogenates. As these aggregation assays require long-term shaking, BMG LABTECH's microplate readers can be equipped with very robust and durable transport systems.
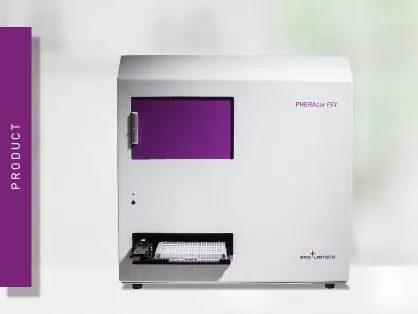
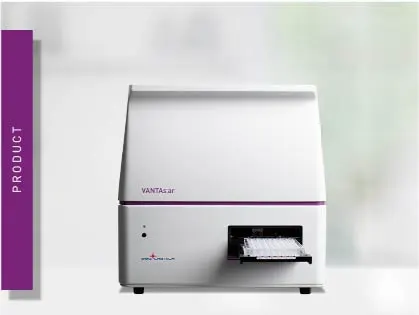
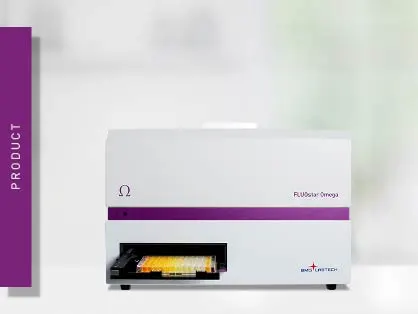
Most flexible Plate Reader for Assay Development
Powerful and most sensitive HTS plate reader
Flexible microplate reader with simplified workflows
Upgradeable single and multi-mode microplate reader series