Cell-based assays have become an irreplaceable tool in life science research and especially in drug discovery. In contrast to biochemical assays, cell-based assays preserve structure and physiological context and offer data with a higher level of biological relevance.
However, this added value typically requires a significantly larger amount of work to plan and prepare such experiments. Many researchers will recognise that the work does not end with the assay set up either. When measuring cell-based assays there can often be additional considerations that one does not face with classical biochemical assays. This HowTo Note highlights the potentially adverse effects of autofluorescent components in cell-based assays on the results and presents some tools to overcome them.
Did you know?
Many of the standard cell-culture media are also available as phenol red-free alternatives.
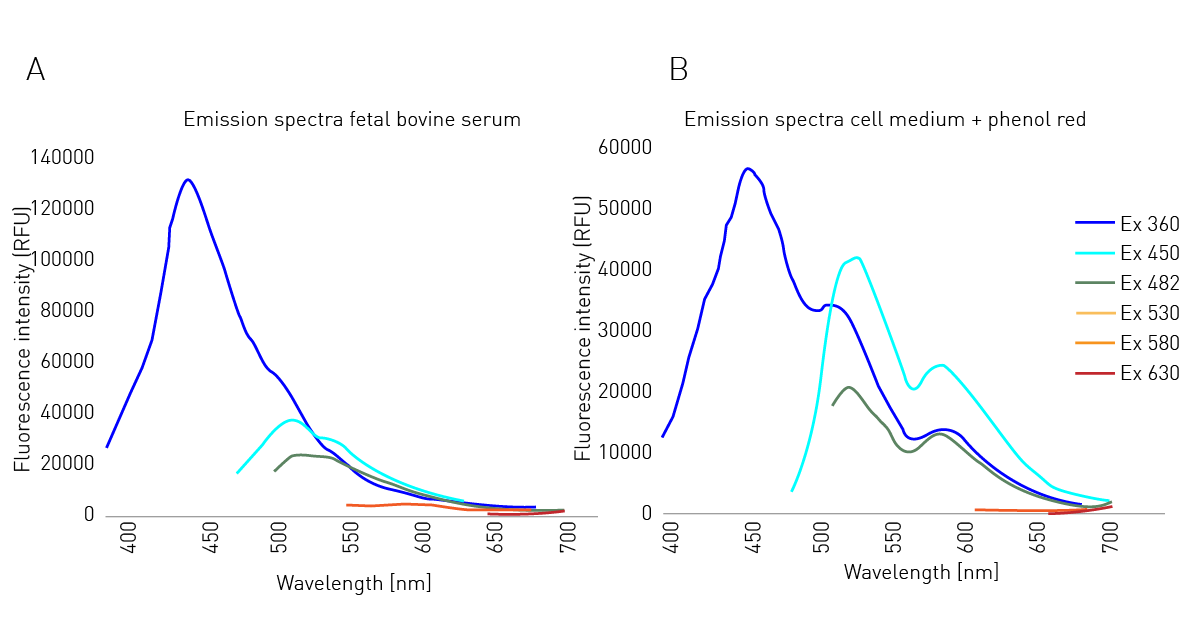
In fluorescent DNA quantification or ELISA assays, the actual target fluorophores are often dissolved in water or a simple buffer solution. These solutions are mainly composed of ions and therefore show only negligible autofluorescence. Cells have different requirements. In many cases, media include carbohydrates, amino acids, as well as various hormones to maintain their metabolic processes. Therefore, cell culture media are often supplemented with serum, such as foetal bovine serum (FBS), to provide cells with the nutrients and signaling molecules they need. Increased autofluorescence in culture media often stems from supplemented molecules with an aromatic side chain. These side chains are often found in amino acids and hormones contained in FBS (fig. 1A) as well as for phenol red (fig. 1B) which is mainly added as a pH indicator. Both FBS and phenol red supplements are known to increase the background levels seen in fluorescence measurements.
It is therefore not surprising that the data quality of cell-based assays is highly dependent on the medium used. The Signal-to-Blank (S/B) ratio is a good indicator of the dynamic range of an assay. The higher the ratio the greater the possibility of being able to distinguish smaller differences between the samples with more confi dence. As shown in figure 2, S/B is highest when cells are evaluated in phosphate-buffered saline with calcium and magnesium (PBS+). Media like Fluoro-Brite™, which are adjusted and optimised to be used for fluorescence detection methods, represent a good alternative to PBS+. Unlike PBS+, they contain nutrients, which are indispensable especially for long-term evaluations with living cells. The S/B ratio is substantially reduced using media containing phenol red and also by suplementation with higher amounts of serum (> 5%).
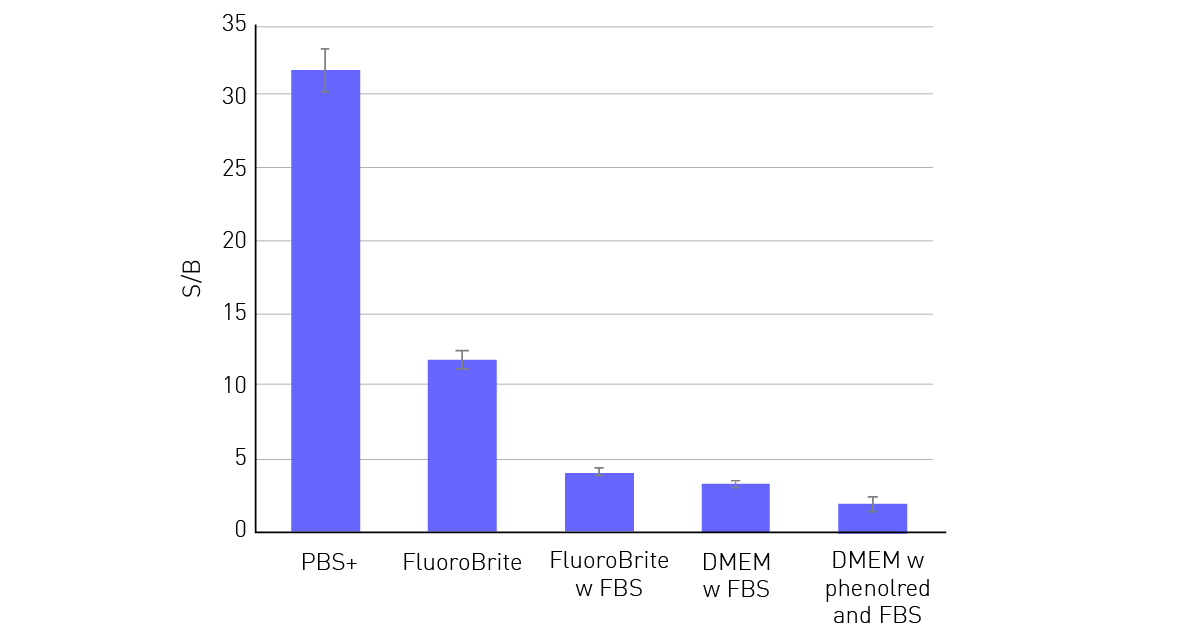
In this example, 50,000 HeLa cells were seeded per well in a 96-well plate, with 10 replicates. After an overnight incubation period, to allow cells to adhere and spread on the well bottom, cells were fixed and stained with Hoechst 33352. Then different media were added to the wells sequentially. Next to the cell-con-taining wells, 36 blank wells (without cells) were measured per medium. Cells were measured from the top with excitation at 360 and emission at 460 nm. Both, FBS and phenol red led to a substantial decrease in the S/B ratio.
Another possibility to circumvent the medium’s impact on the dynamic range of a measurement is the use of bottom optics. Instead of measuring from above the well, bottom optics allow excitation and measurement from below the plate. This way the excitation and emission light does not have to travel through the supernatant above the cells. This results in a limited excitation of the autofluorescent components present in the medium and generally in a decreased light loss through scattering or absorption by non-specific substances. The benefits of bottom reading are particularly evident when measuring with autofluorescent media, as can be seen in figure 3. The S/B ratio decreases in general when cells are measured in media instead of PBS+ especially if the media are supplemented with FBS or phenol red.
Did you know?
On BMG LABTECH readers, you can simply switch between top and bottom reading with a click in the control software. No hardware displacement is necessary.
Accordingly, the benefits that result from using bottom reading are most notable when measuring in cell culture media supplemented with FBS and/or phenol red, where the S/B ratios exceed those obtained with the top optics.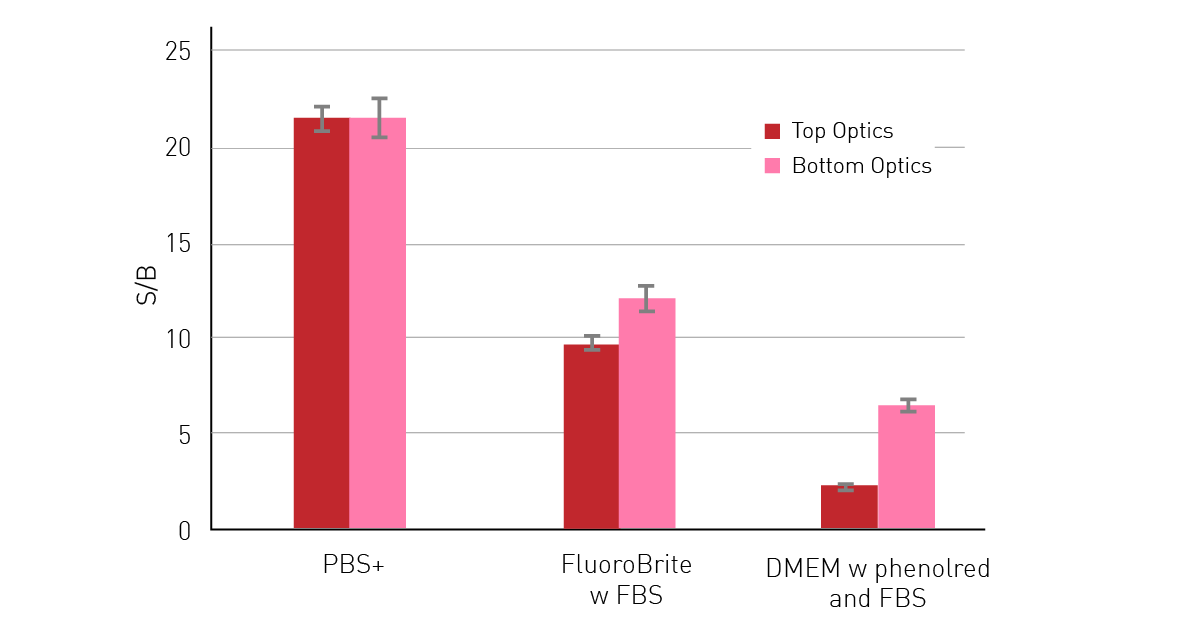 50,000 HeLa cells expressing RFP were seeded per well in a 96-well-plate, with 10 replicates. After an overnight incubation period, to allow cells to adhere and spread on the well bottom, different media were added to the wells sequentially and measured with excitation at 580 and emission at 620 nm with top and bottom optics. Next to the cell-containing wells, 36 blank wells (without cells) were measured per medium. Bottom reading significantly reduces the effect of autofluorescent media.
Did you know?
In many biomolecular assays on a microplate reader, top reading can provide 4-8 times higher sensitivity compared to bottom reading due to the influence of the microplate material on transmission and autofluorescence. However, in cell-based assays this is not always the case as reading from below the plate and avoiding having to measure through the supernatant outweighs the other factors.
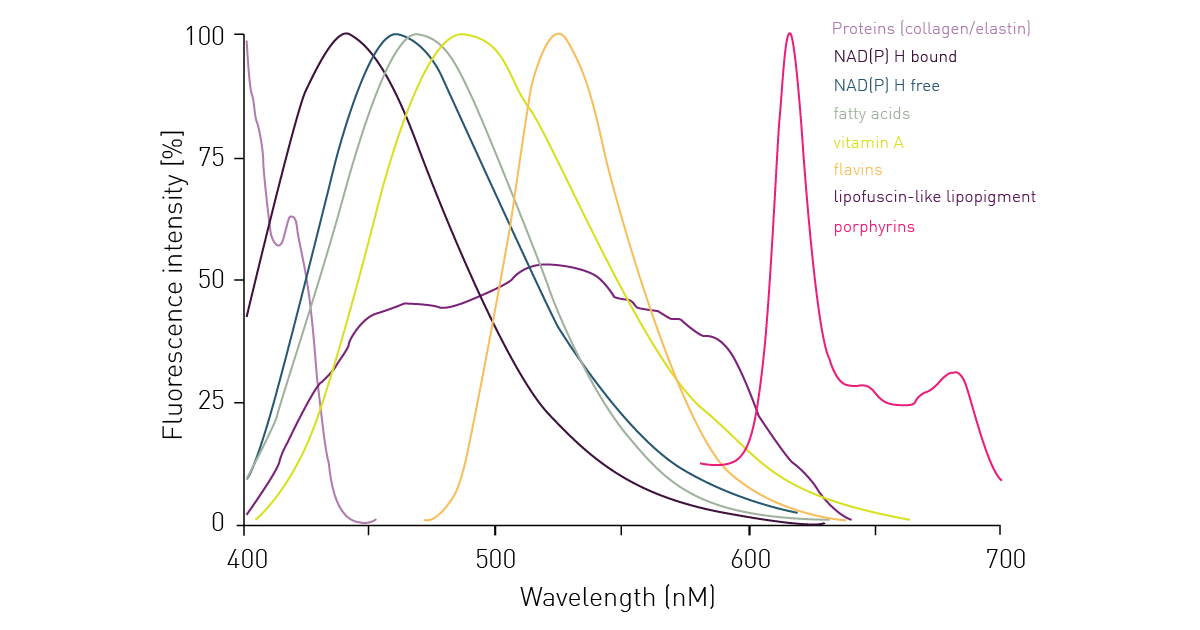
Besides external sources of autofluorescence, you also have to consider the non-specific signal that may be generated by intracellular components upon excitation. As cells contain various proteins including aromatic amino acids, and other natural components, they themselves may generate an autofluorescent signal upon excitation by a specific wavelength (fig. 4). So even if background fluorescence derived from autofluorescent media in the supernatant is reduced, cells themselves still represent a remarkable source of autofluorescence. It is easy to see from the graph below that cellular components give the highest interference in the blue to green emission range up to 600 nm.
 One possibility to circumvent cell-derived autofluorescence is to use red-shifted fluorophores that emit at higher wavelengths and avoid the blue-green region for detection such as the one highlighted in the application note: Near-infrared FRET biosensor for multiplexing interrelated signalling of small GTPases. The switch to red-shifted dyes is of course limited to their availability in specific assay kits or as conjugated dyes. With increasing availability of red dyes, their use in cell-based assays is becoming more common and if there is an alternative to your assay/application with a red dye, this usually results in significant advantages for the data quality. Figure 5 shows data of a cell line concomitantly expressing red fluorescent protein (RFP) and green fluorescent protein (GFP). Detection of the same cell samples results in a more than 5 times higher S/B ratio when RFP is detected instead of GFP. A different approach to reduce the influence of autofluorescence can be the use of polarized light. However, it is important to note that this method is not widely used.
Did you know?
BMG LABTECH offers dedicated red-shifted PMTs which offer high sensitivity also in the detection range above 740 nm for the CLARIOstar.
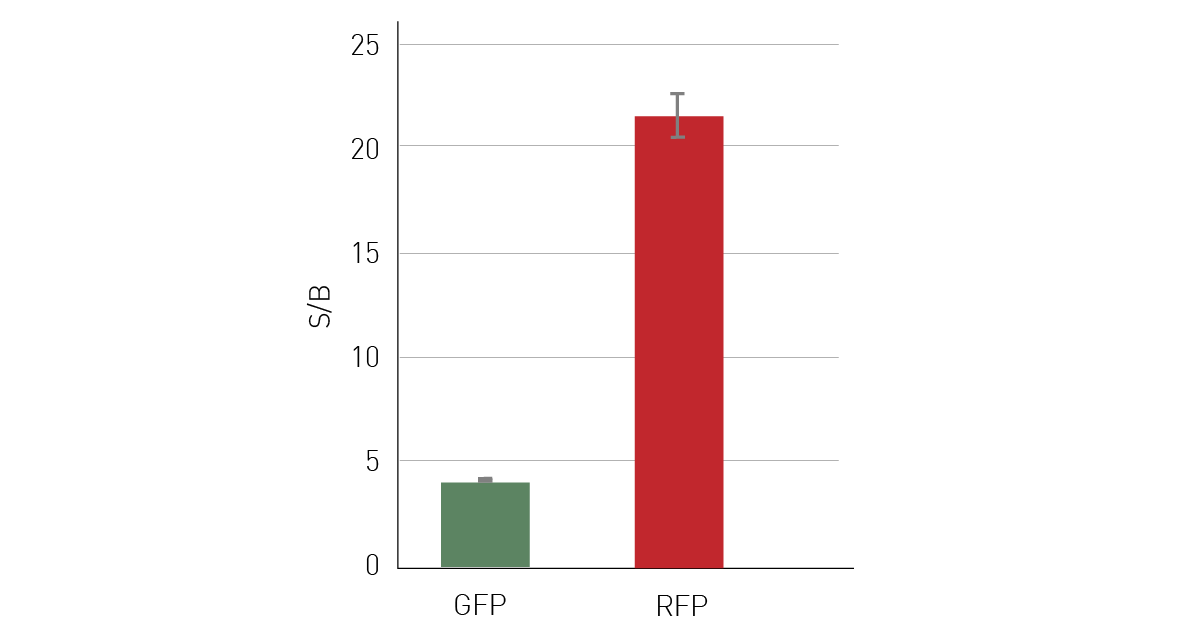
HeLa cells, expressing both GFP and RFP were seeded with 50,000 cells/well in a 96-well plate, with 10 replicates and 36 blank wells without cells. After an overnight incubation period, to allow cells to adhere and spread on the well bottom, medium was aspirated and replaced with PBS+. Sequential measurements at excitation 482 and emission 530 nm to determine the GFP signal intensity and at excitation 580 and emission 620 nm for RFP were performed on the same samples using bottom reading. At comparable expression levels, RFP evaluation resulted in substantially higher S/B ratios.
Conclusion
The main recommendations for the measurement of cell-based assays especially when using fluorescence detection are summed up here:
- When measuring live cells, try to avoid phenol red in your medium and reduce serum supplementation to a necessary minimum. If possible, switch to a medium with low autofluorescence like FluoroBriteTM
- If available, use bottom rather than top optics especially for adherent cells with an autofluorescent supernatant
- If working with short-term measurements of fixed cells consider measuring in buffer with low autofluorescence such as PBS+
- Where possible consider using red-shifted dyes to avoid cell-derived background fluorescence
- Initial recommendation
- Detailed Recommendation