






Introduction
The solute carrier KCC2 is a potassium-chloride symporter expressed in neuronal cells. Increased KCC2 expression during development leads to lowered neuronal chloride levels. Patients with Rett syndrome maintain a higher chloride level as they mature leading to disrupted development. KCC2 agonists have been suggested as possible treatments for Rett syndrome and other diseases mediated by high neuronal chloride.
In order to screen possible small molecule activators of KCC2, Glorider, a NanoBRET-based biosensor capable of measuring intracellular chloride levels in real time in response to KCC2 modulating compounds was developed 1.
Assay principle
The Glorider biosensor consists of the chloride sensitive GFP variant E2GFP fused to a nanoluciferase (NanoLuc). Addition of the NanoLuc substrate Furimazine causes NanoLuc to produce light, which in turn excites the fused GFP. Binding of chloride to GFP quenches this signal. Intracellular chloride levels are measured in HEK293 Jump-In™ cells stably expressing the Glorider biosensor and KCC2. The signal from extracellular biosensor is blocked through the use of a cell-impermeable NanoLuc inhibitor. 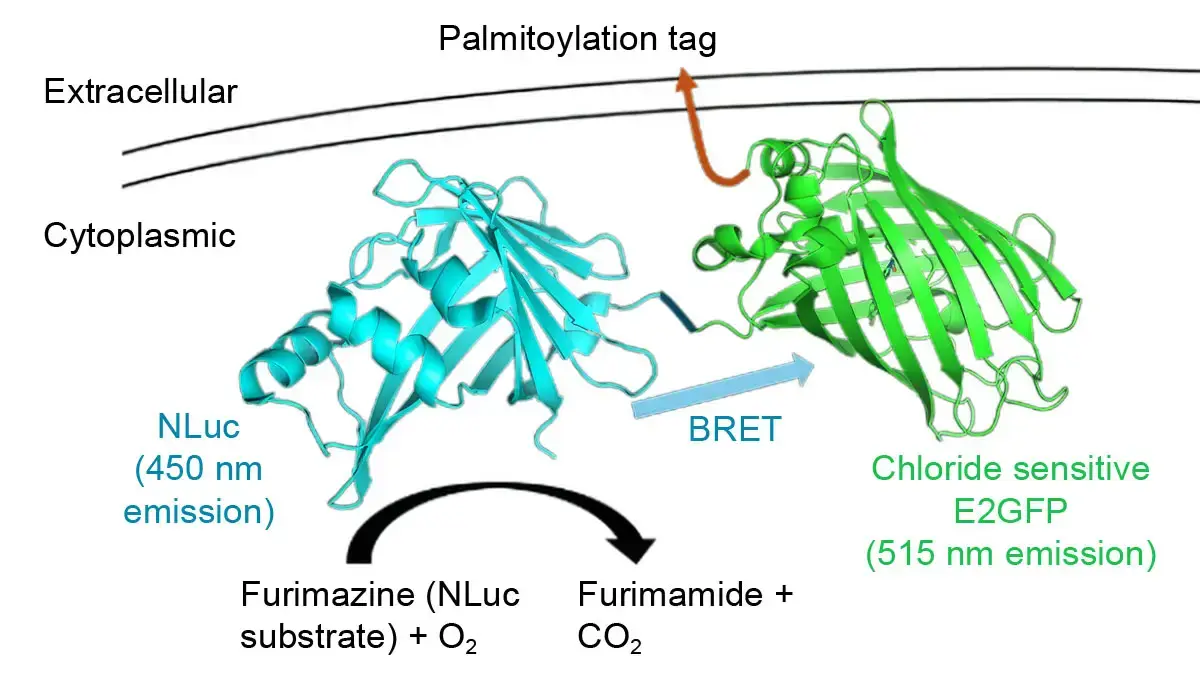
Materials & methods
- White 384-well PD-L coated microplates (Greiner)
- NanoLuc Substrate and NanoLuc extracellular inhibitor (Promega, #N2162)
- Hanks Buffer Salt Solution (HBSS; pH7.2)
- Doxycycline (MP Biochemicals)
- Test compounds
- Triton X-100
- HEK293 Jump-In™ cell line (Thermofisher)
- Pherastar FSX plate reader (BMG LABTECH)
Experimental Procedure
Cell culture and seeding:
HEK Jump-In cells stably expressing KCC2 under a doxycycline controlled promoter were stably transfected with the Glorid-er biosensor. These HEK KCC2 Glorider cells were cultured in high glucose DMEM Glutamax (Invitrogen) with 10% dialyzed FBS (Gibco), 1/100 diluted MEM (Gibco), 25 mM HEPES (Merck) and 1/100 diluted penicillin/streptomycin (Merck). 24 hours prior to the experiment HEK KCC2 Glorider cells were seeded at 20,000 cells per well in 40 µL culture medium into a 384-well white PDL coated microplate, with 0.08 ng/mL Doxycycline.
Compound preparation:
A Mosquito liquid handler (SPT Labtech) was used to prepare titrations of compounds of interest in 384-well V bottom dilution plates which were normalized to 600 nL per well with DMSO. HBSS (pH 7.2) was then added to the plate so compounds were at twice their desired final assay concentration. The microplate was then incubated at 37°C.
Characterization of chloride modulators:
Media was removed from the cell plate and replaced with 20 µL pre-warmed HBSS (pH 7.2) containing 1 in 250 NanoLuc substrate and 30 µM NanoLuc extracellular inhibitor. A white plate back was added, and the BRET signal measured every 2 minutes for 20 minutes on the PHERAstar FSX at 37°C. Following this equilibration read, the microplate was removed from the reader and 20 µL of the test compounds were added. The microplate was then returned to the reader and read under equivalent settings for another 80 minutes.
Instrument Settings
|
Luminescence, plate mode kinetic
|
||
|
Optic settings |
Optic module
|
NanoBRET |
|
General settings |
Measurement interval time |
0.2 s |
|
Settling time |
0 s |
|
|
Kinetic settings |
Number of cycles |
10 + 40 |
|
Cycle time |
120 s |
|
|
Incubation |
37°C |
|
Results & Discussion
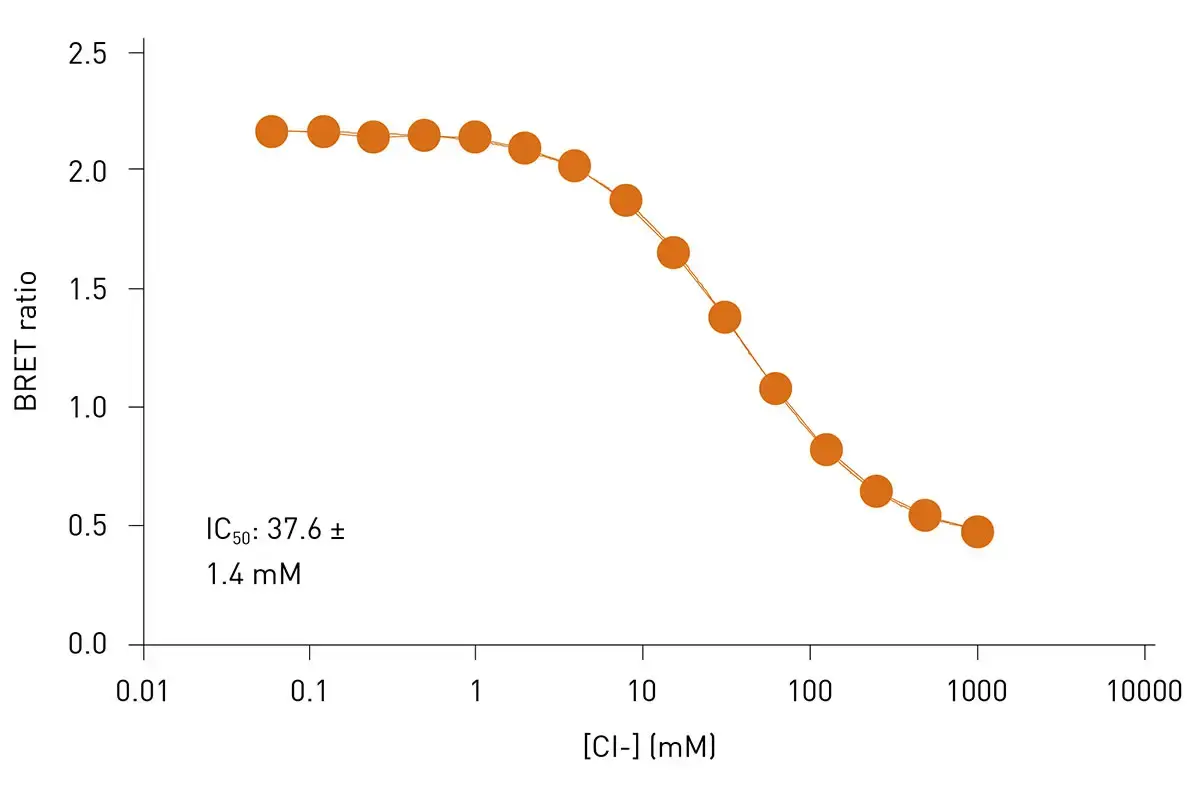
To convert NanoBRET values into intracellular chloride concentrations a control chloride reference curve was prepared in lysed cells expressing the receptor (Figure 2). As the absorbance of E2GFP is modulated by pH, care should be taken to ensure that the standard curve is conducted in pH 7.2 media.
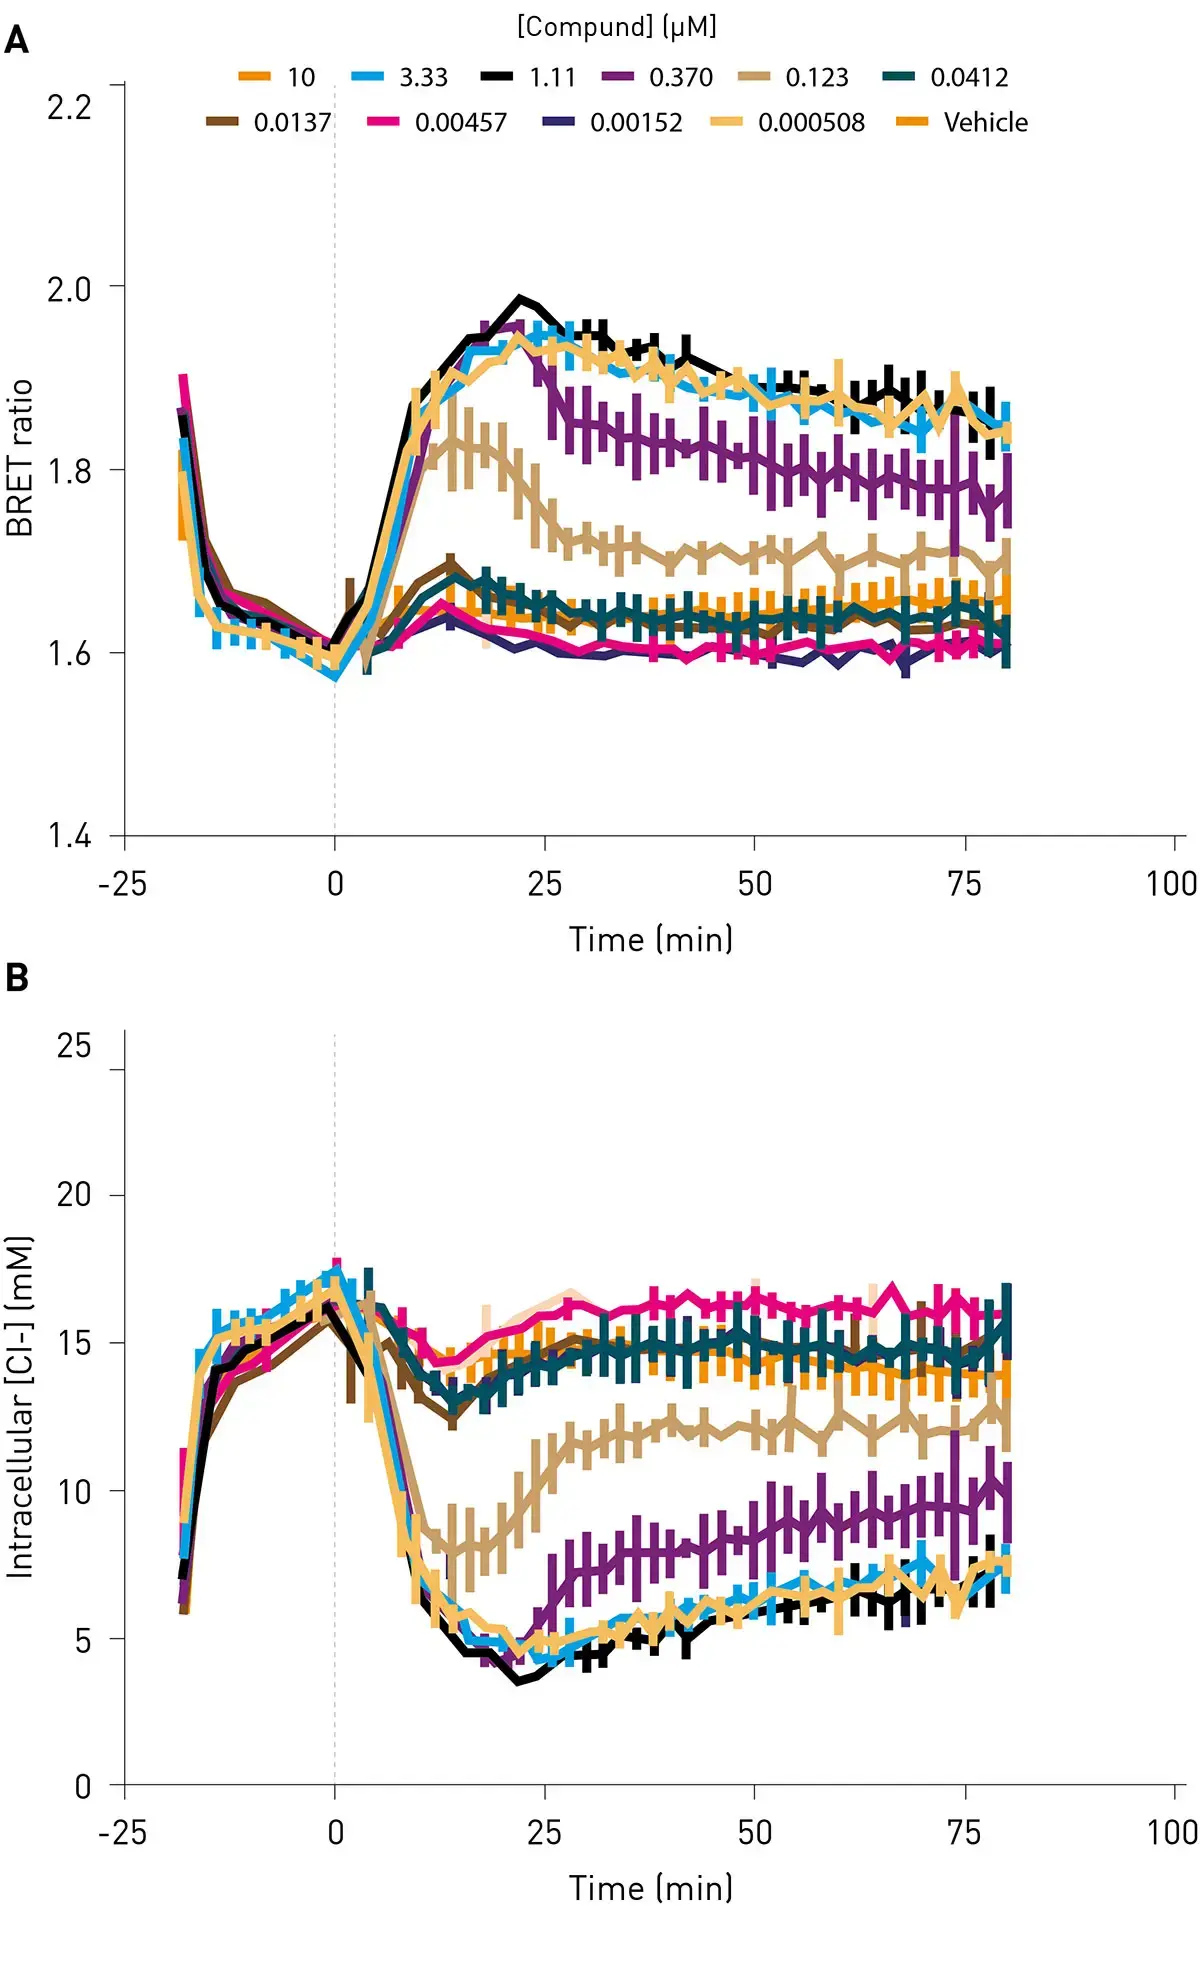
The addition of chloride modulating compounds to intact cells expressing the Glorider biosensor, including e. g. the WNK antagonist WNK463 (Figure 3) caused changes in the NanoBRET ratio. In the case of WNK463, the WNK kinase-mediated inactivation of chloride exporting channels is inhibited. Thus, compound addition leads to a decrease of intracellular chloride and consequently an increase in the measured BRET ratio. Predicted intracellular chloride concentrations can then be interpolated from the standard reference curve using the below equation (provided the cellular pH is not predicted to change):
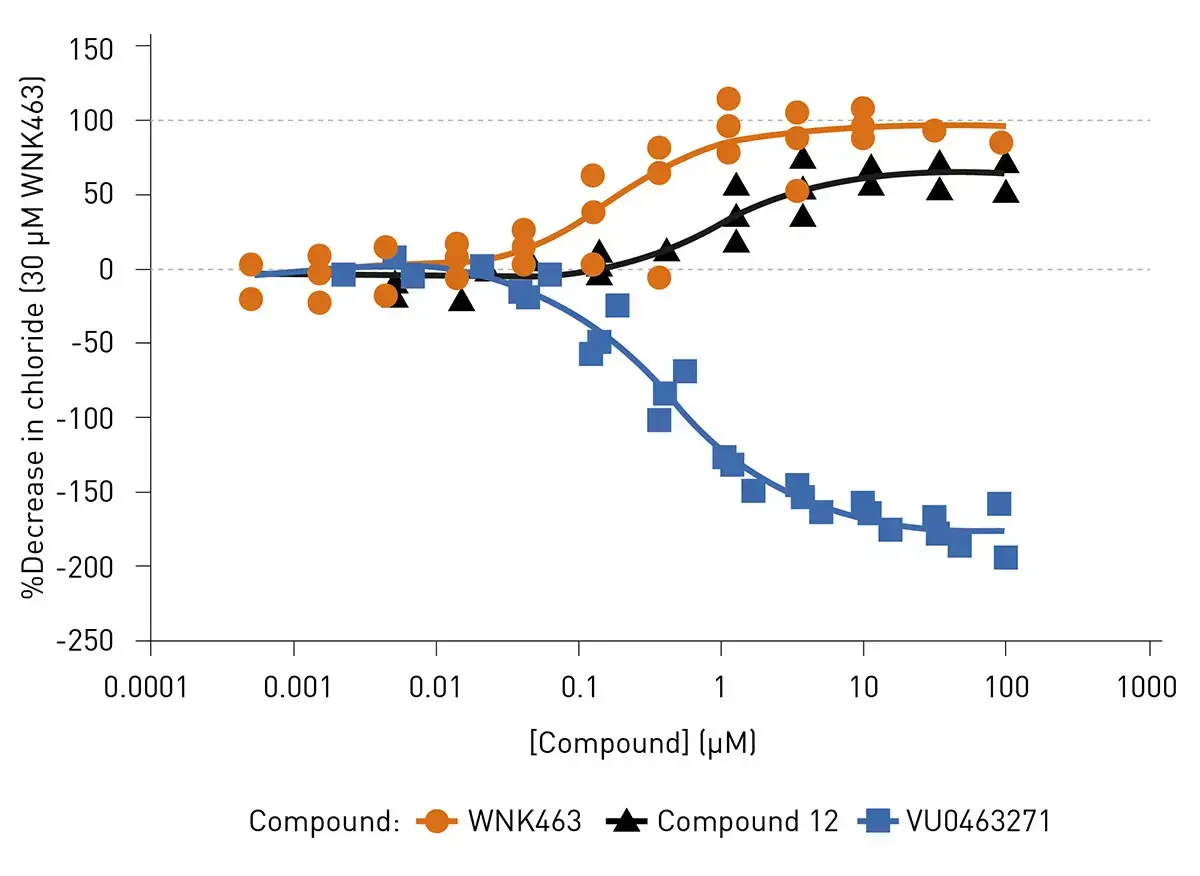
The area under curve (AUC) from the kinetic plot can then be calculated and expressed as a % the relative decrease in chloride induced by 30 µM WNK463. This analysis allows the inhibitory or agonistic effect of test compounds on cellular chloride levels be quantified using a conventional 4 parameter fit (Figure 4).
Conclusion
The Glorider assay system can be used in conjunction with a PHERAstar FSX plate reader to measure dynamic compound induced changes in intracellular chloride concentration.
References
- Lay, Charles S., et al. “Development of a BRET based chloride biosensor for high throughput screening of KCC2 modulators.” SLAS Discovery (2025): 100245.