Introduction
STUB1 (CHIP) is a chaperone-associated E3 ubiquitin ligase that connects Hsp70/Hsp90 client handling to ubiquitin-dependent protein quality control. In this pathway, the N-terminal TPR domain binds the conserved Hsp70/Hsp90 C-terminal EEVD motif, providing a defined recruitment interface that links chaperone engagement to STUB1 function1. Because this axis is important for human health, STUB1 has become a focus for chemical modulation 2,3.
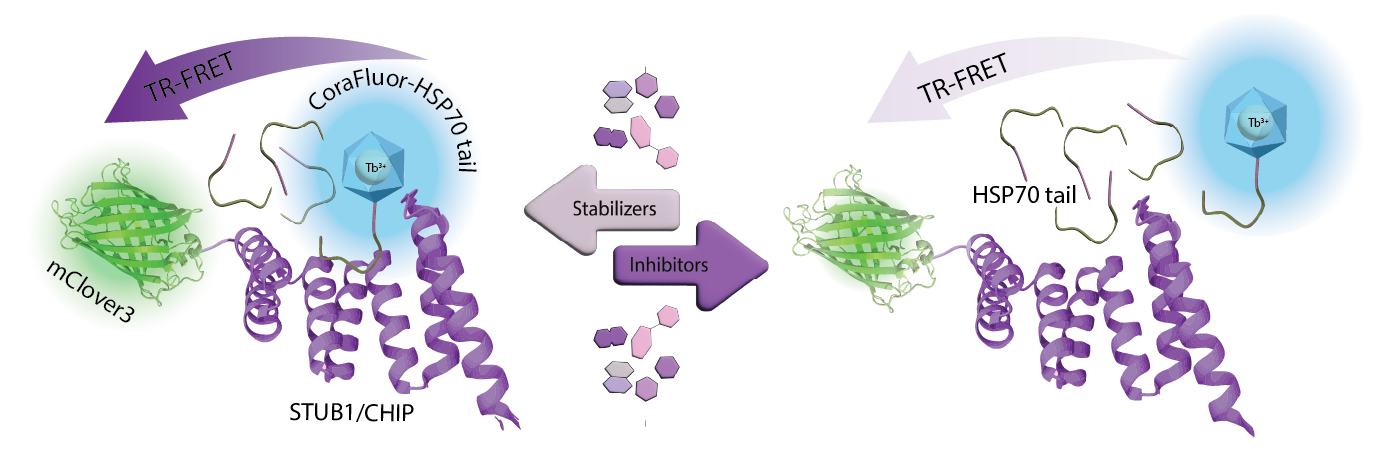
To enable discovery and profiling of compounds that modulate the STUB1–Hsp70 interaction, we developed a homogeneous TR-FRET assay. This assay pairs a genetically encoded, site-defined acceptor (mClover3–STUB1(TPR)), avoiding chemical labelling of the protein and simplifying assay build, with an N-terminal CoraFluor™ 1–labelled Hsp70 C-terminal peptide donor, leveraging a bright terbium donor chemistry for TR-FRET4,5. CoraFluors are highly sensitive, high brightness terbium FRET donors, developed by Bio-Techne for TR-FRET assay development.5
Despite this streamlined format, the assay delivers an ~50%window and excellent robustness (Z′ = 0.92), supporting HTS and SAR workflows.
Assay principle
Materials & methods
- Solid white, 384-well, flat bottom microplate (Corning, #3825)
- CoraFluor™ 1, amine-reactive dye (Tocris/Bio-Techne, #7920)
- Human STUB1 (CHIP) TPR domain fused to mClover3
(expressed in-house) - HSP70 peptide (SGGASSGPTIEEVD; AnaSpec)
- Assay buffer: 50 mM HEPES (pH 7.4), 50 mM KCl,
0.01% Triton X-100 (v/v) - Other reagents from commercial sources
- CLARIOstar Plus (BMG LABTECH)
Experimental Procedure
Assays were assembled directly in solid white 384-well plates in a final volume of 30 µL per well using assay buffer. STUB1–mClover3 was first dispensed into wells, followed by test compounds or unlabelled peptide competitor from intermediate working dilutions, such that the final DMSO concentration was ≤0.1% (v/v). The CoraFluor-labelled HSP70 peptide (amine-reactive labelling performed in-house) was added last to initiate the binding reaction. Plates were incubated at room temperature for 5 min and measured as an endpoint TR-FRET read with top optics.
Instrument Settings
|
TR-FRET, endpoint
|
||
|
Optic settings
|
Dual Chromatic
|
|
|
Filters |
Ex: EX TR Dichroic: LP TR Em 1: 490-10 Em 2: 520-10 |
|
|
Flashes |
200 |
|
|
Gain |
EDR |
|
|
Focus |
8.1 mm |
|
|
General settings
|
Settling time |
0.3 s |
|
Integration start |
100 µs |
|
|
Integration time |
400 µs |
|
Results & Discussion
We first optimized assay conditions to maximize the competitive TR-FRET window for the STUB1–HSP70 peptide interaction. CoraFluor-labelled HSP70 peptide was tested at 1, 5, 10, and 20 nM against mClover3–STUB1 across 250, 500, 1000, and 5000 nM. Donor (490 nm) and acceptor (520 nm) signals were blank-subtracted using buffer-only wells, and TR-FRET was calculated as the ratiometric signal (520/490 × 10,000). For each matrix condition, high-FRET controls (no competitor) and low-FRET controls (10 µM unlabeled peptide competitor) were measured and used to calculate the normalized assay window, which was visualized as a heatmap (Figure 2).

This analysis identified 10 nM labelled peptide with 250 nM mClover3–STUB1 as the condition providing the largest separation between high and low controls, reaching an assay window of ~50%, and this condition was carried forward for subsequent assay validation. Using the optimized concentrations, assay robustness was assessed by comparing replicate high-FRET and low-FRET control wells and calculating the Z′ factor. The control populations were well separated with low variance, yielding a Z′ of 0.92, consistent with a highly robust assay suitable for screening and profiling workflows in 384-well format (Figure 3)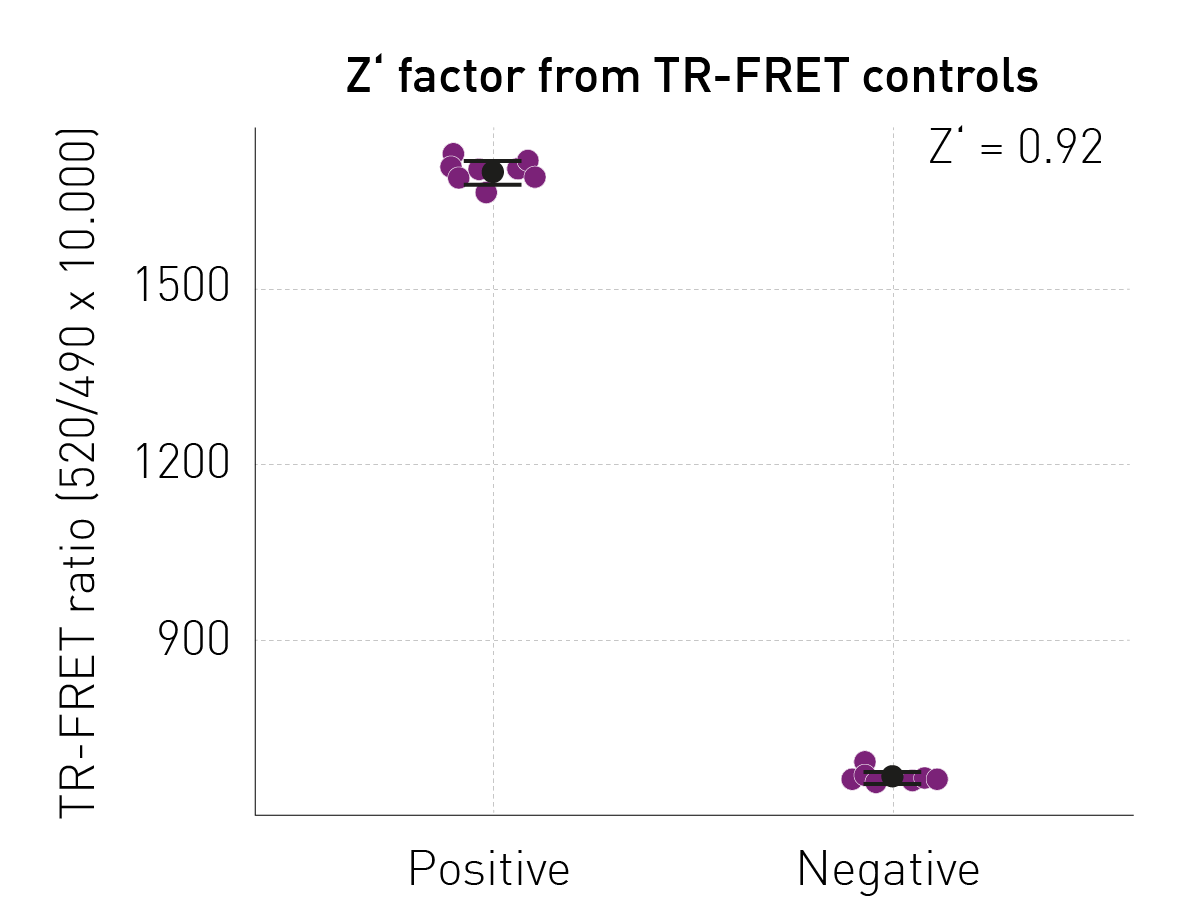
To confirm that the readout reflects specific binding and can be displaced in a concentration-dependent manner, an 8-point titration of unlabelled competitor peptide was performed under the optimized conditions. Increasing competitor concentrations reduced TR-FRET in a sigmoidal manner, and curve fitting returned an EC50 of 0.71 µM (Figure 4). 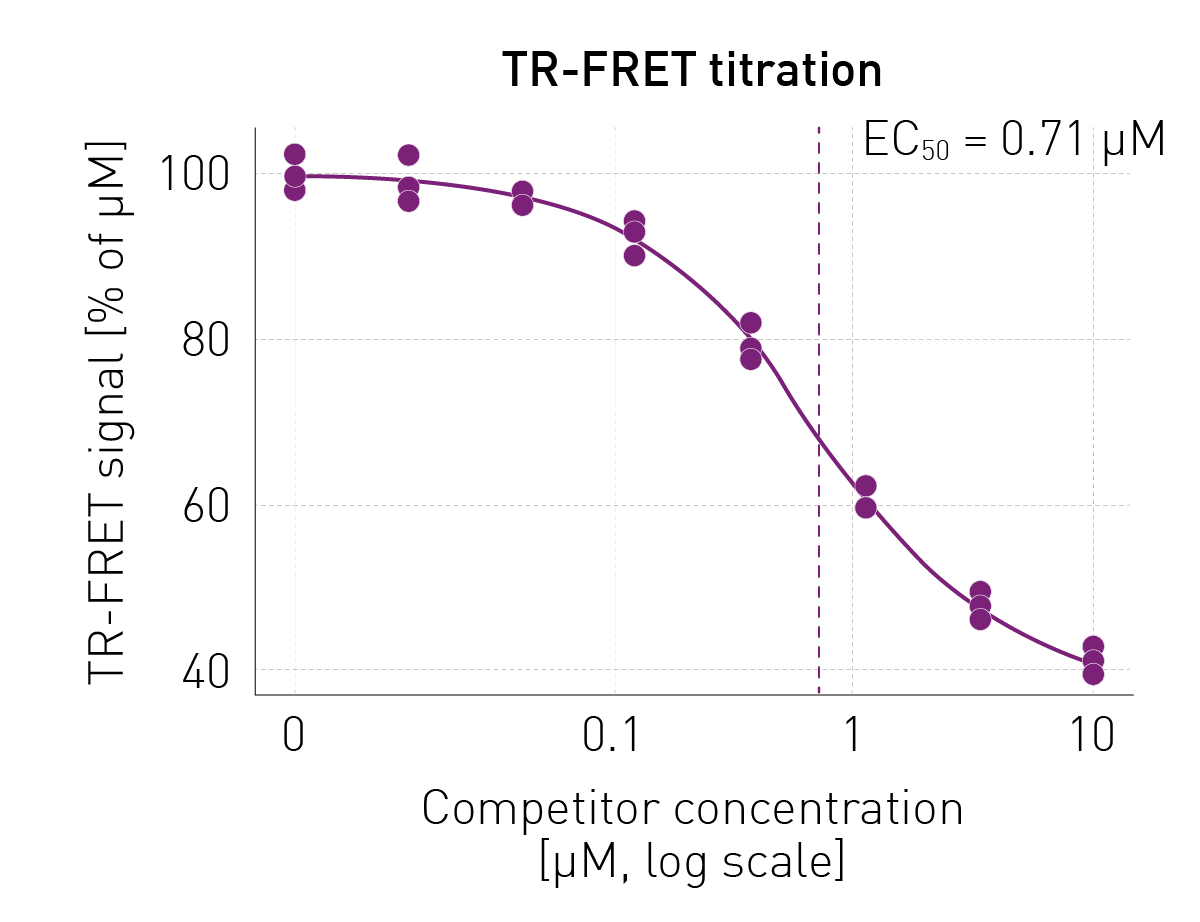
Conclusion
This application note describes a homogeneous, ratiometric TR-FRET competitive binding assay to monitor STUB1/CHIP interaction with an HSP70 C-terminal peptide in a 384-well microplate format. The streamlined format supports screening and SAR workflows and can be adapted to other peptide-protein interaction assays.
References
- McDonough, H., et al. CHIP: a link between the chaperone and proteasome systems. Cell Stress Chaperones. (2003) 8: 303–308
- Kanack, A. J., et al. Chemical Regulation of the Protein Quality Control E3 Ubiquitin Ligase C-Terminus of Hsc70 Interacting Protein (CHIP). ChemBioChem. (2022) 23: e202100633
- Lucas, S. C. C., et al. Discovery of Small-Molecule Ligands for the E3 Ligase STUB1/CHIP from a DNA-Encoded Library Screen. ACS Med. Chem. Lett. (2025) 16: 1445–1451
- Bajar, B. T., et al. Improving brightness and photostability of green and red fl uorescent proteins for live cell imaging and FRET reporting. Sci. Rep. (2016) 6: 20889
- Payne, N. C., et al. Bright and stable luminescent probes for target engagement profi ling in live cells. Nat. Chem. Biol.(2021) 17: 1168–1177