









Introduction
Apoptosis is a tightly regulated form of cell death, and it plays a central role in development and disease. Its dysregulation is strongly linked to cancer, where impaired apoptotic signaling allows abnormal cells to survive and proliferate. Accordingly, thorough understanding of the mechanisms and causes of apoptosis is a key element in the development of new therapeutic approaches. Furthermore, testing for apoptotic effects is an important tool in drug development for initially classifying potential drugs for a wide range of targets based on their general effect on cellular viability.
The mitochondrial membrane potential is an essential prerequisite for ATP generation during the process of oxidative phosphorylation, and thus a clear indication of cellular health. Opening of the mitochondrial permeability transition pores leads to membrane depolarization, as an early event in apoptosis. This depolarisation can be monitored with various approaches, e.g. with JC-10. In this application note we demonstrate how a JC-10 assay can be used to monitor different degrees of apoptosis in an adherent cell culture.
Assay principle
JC dyes are cationic carbocyanine dyes that are membrane-permeant. JC-10 is added in its unaggregated (monomeric) form to the cell culture. Due to its lipophilic properties, JC-10 readily partitions from the aqueous phase into cellular lipid environments and crosses the plasma membrane by passive diffusion. Once in the cytosol, the positively charged JC-10 dye is driven into the mitochondrial matrix by its negative membrane potential. In healthy mitochondria, JC-10 accumulates to high local concentrations, promoting self-association into aggregates that emit orange/red fluorescence (figure 1). In apoptotic cells, the mitochondrial membrane potential collapses, and JC-10 redistributes from mitochondria throughout the cell. As a result, the aggregates dissociate and JC-10 shifts from red fluorescing polymers back to green fluorescing monomers. This shift can be used as indicator for apoptosis.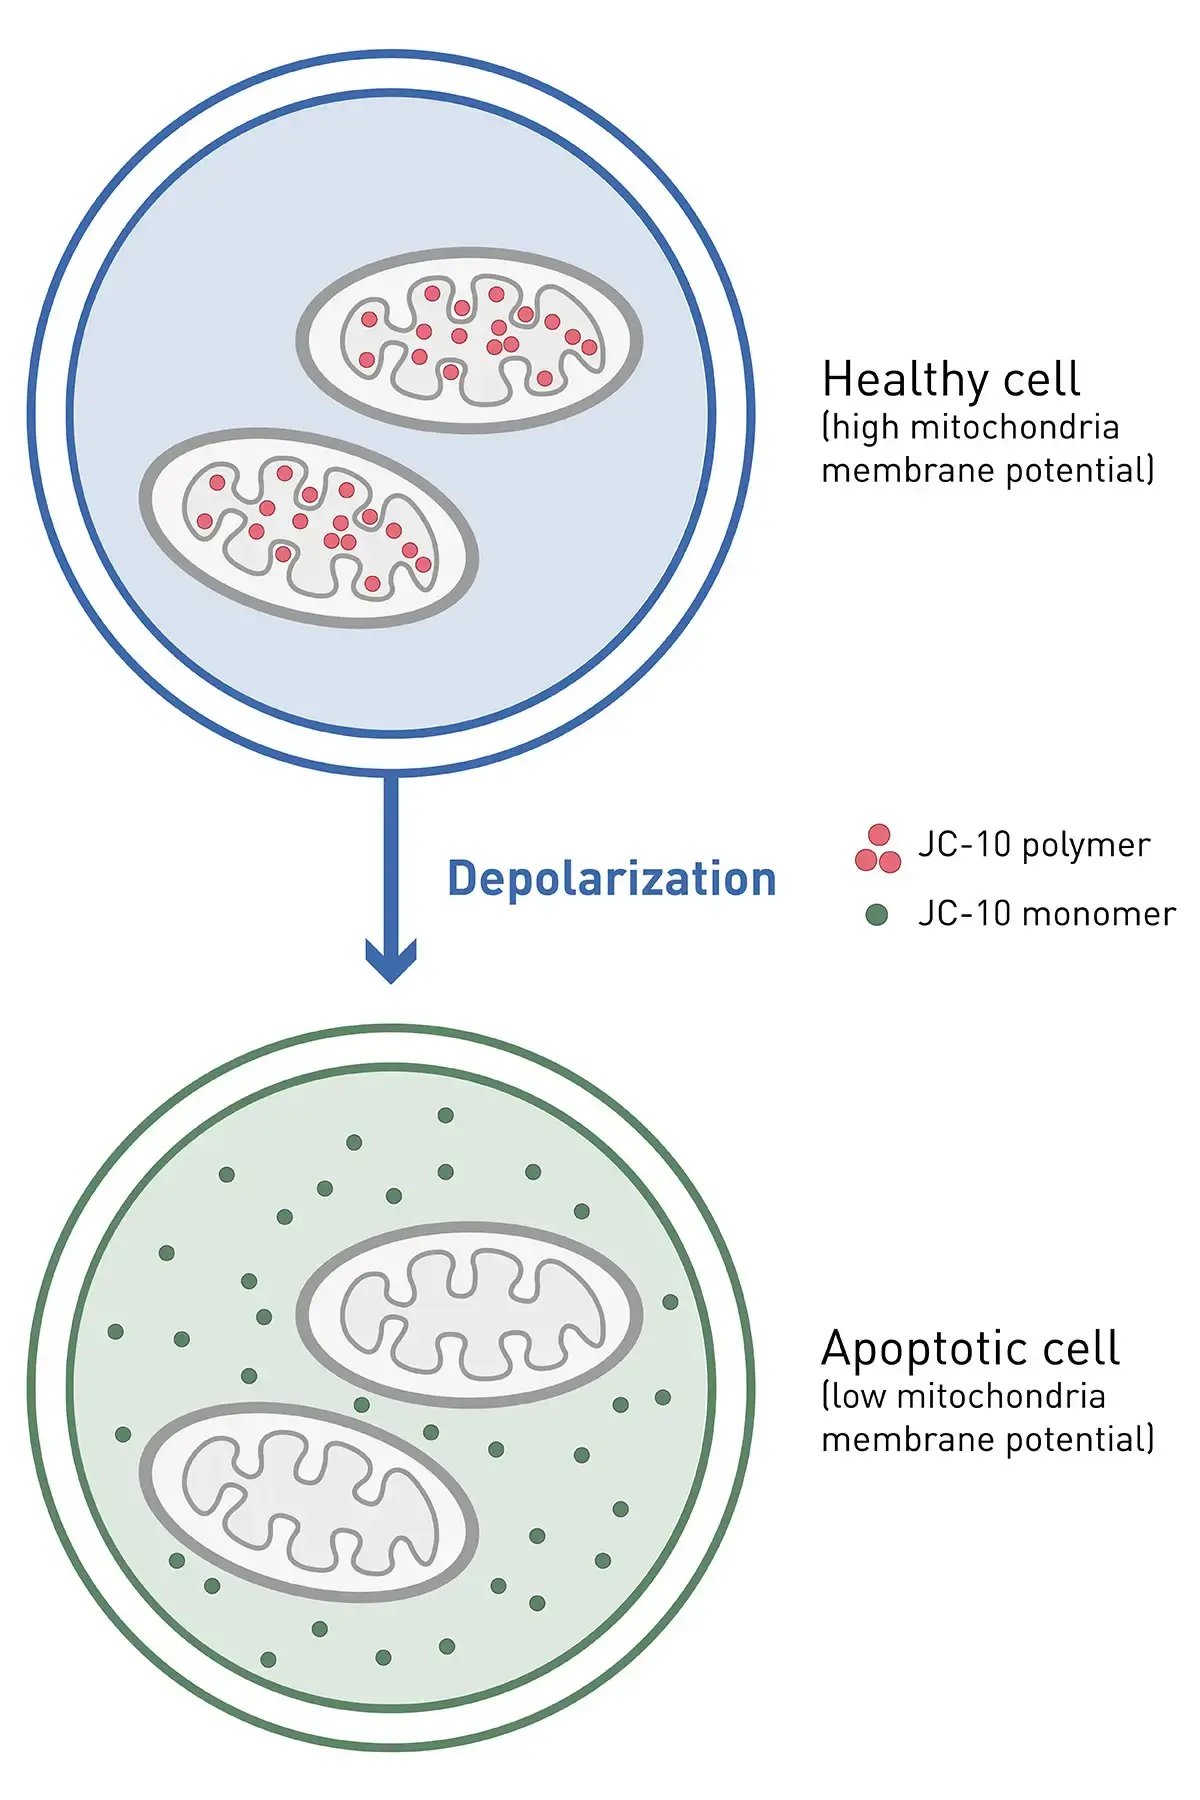
Materials & methods
- 96-well plate, black, transparent bottom – Screenstar (#655866, Greiner BioOne)
- HeLa cell line (#ACC57, DMSZ)
- FluoroBriteTM DMEM (#A1896701) with 2mM glutamine 5% FBS and 1% pen/strep (all Thermo Fisher)
- Staurosporine (#15405149, Fisher Scientific)
- JC-10 dye (#ab112134, Abcam)
- CLARIOstar® Plus (BMG LABTECH)
Experimental Procedure
For the JC-10 assay, HeLa cells were seeded in a 96-well plate with 20,000 cells/well in 100 µL supplemented growth medium (5% fetal bovine serum – FBS, 2mM glutamine and 1% pen/strep) and incubated overnight at 37 °C and 5% CO2. The next day, medium was aspirated from adherent cells and replaced with 100 µL supplemented growth medium in each well containing different concentrations of the apoptotic inducer staurosporine ranging from 0.16 to 40 µM, with four replicates each. As a negative control, cells obtained growth medium without staurosporine, but including the vehicle DMSO. Cells were incubated for 4 h at 37 °C and 5% CO2.
The JC-10 assay reagent was prepared by diluting and mixing the 100x JC-10 dye with buffer A. The induction medium, containing staurosporine, was aspirated from the cells and replaced with 100 µL growth medium. Additionally, 50 µL 1x JC-10 assay reagent in buffer A was added per well and incubated with the cells for 45 min at 37 °C and 5% CO2. Finally, 50 µL buffer B (stop buffer) was added to each well and the fluorescence of the monomeric and polymeric form of JC-10 was evaluated with a CLARIOstar Plus using the following settings.
Instrument Settings
|
Fluorescence Intensity, endpoint
|
||
|
Optic settings
|
Used Optic |
Bottom Optic |
|
LVF settings JC-10 monomer |
Ex: 490-15 |
|
|
LVF settings JC-10 polymer |
Ex: 540-20 |
|
|
General settings
|
Number of flashes |
Spiral avergaing and no well scan: 100 flashes |
|
Matrix scan: 1 flash (this will result in 100 flashes total in a 10x10 matrix) |
||
|
Focal height |
1.3 mm |
|
|
Scan settings |
Spiral averaging |
5 mm diameter |
|
Matrix scan |
5 mm diameter, 10 x 10 matrix |
|
|
Gain |
Spiral averaging |
Automatic gain adjustment with 50% target value on highest standard |
|
No well scan and matrix scan |
EDR |
|
Results & Discussion
Replicates were analysed using BMG LABTECH’s LVF Monochromator, which combines full wavelength flexibility with filter-like transmission characteristics. Following data acquisition, the emission signal at 525 nm (JC-10 monomer peak) was divided by the emission signal at 590 nm (JC-10 aggregate peak). The untreated negative control representing healthy cells was defined as 100%, and all other conditions were normalised accordingly (figure 2).
Spiral averaging and matrix scans were compared with measurements performed without any well-scanning option. Matrix scanning combined with the EDR feature provided the greatest dynamic range, followed by spiral averaging. Measurements acquired without well-scanning showed the lowest dynamic range and higher relative standard deviations. Despite these differences in data quality, all three approaches generated comparable dose-response profiles, reflecting a staurosporine concentration-dependent increase in apoptosis from minimum to maximum effect. Obtained EC50 values ranged from 4.0-4.7 µM and are well in line with other reports1.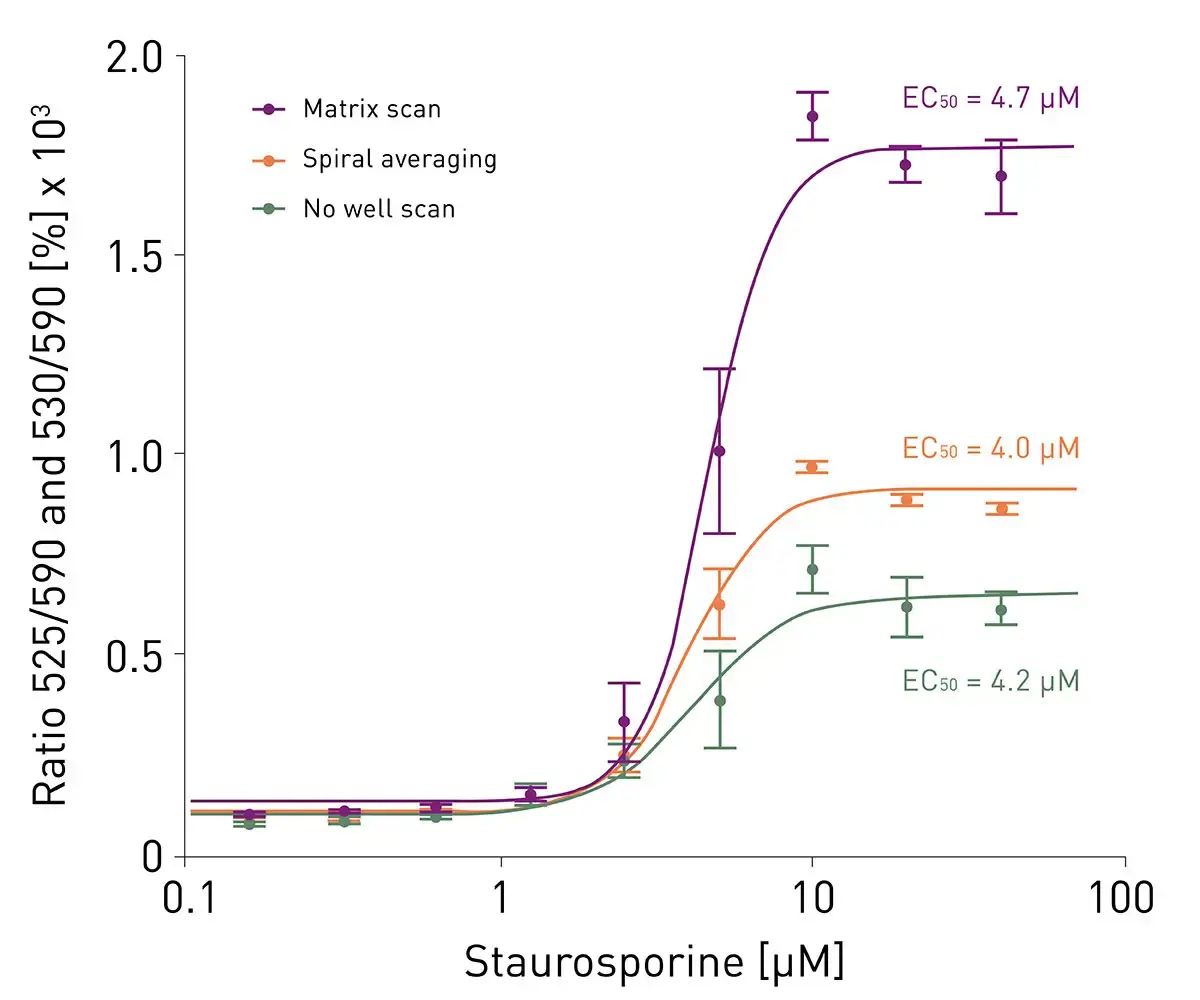
Additionally, matrix scanning offered localised signal resolution throughout the well, allowing the detection and monitoring of regional differences in cell seeding as well as variations in the distribution of apoptotic cells inside each well (figure 3).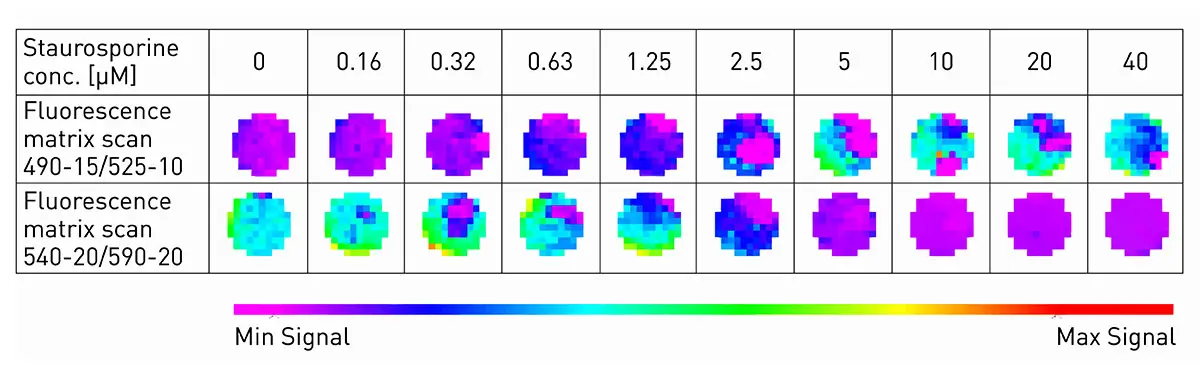
Conclusion
The CLARIOstar Plus enables highly sensitive and reproducible detection of both, green JC-10 monomer, and red JC-10 aggregate fluorescence, allowing reliable assessment of mitochondrial membrane potential through ratiometric analysis. Its bottom-reading optics enable direct measurements of the JC-10 assay in adherent cell cultures within the assay plate, whilst the advanced LVF Monochromators and automated focal height optimisation maximise signal acquisition and experimental flexibility. Together, these features make the CLARIOstar Plus a powerful platform for robust mitochondrial membrane potential and apoptosis research. Using templates, the required calculation steps can be applied to future measurements automatically in the MARS Data Analysis Software. Furthermore, the MARS Data Analysis Software allows all required calculation and analysis steps to be incorporated into customisable templates, enabling their automatic application to future measurements and ensuring standardised data processing.