Introduction
In vitro screening for protein ligands is a crucial step for drug development. For proteins with known peptide ligands, fluorescence polarization offers a versatile approach in initial screening campaigns for several reasons: I) only purified protein of interest (POI) and a fluorescently-labeled peptide are required. II) low assay volumes reduce consumables and cost. III) compound titrations can yield KI values.
Here, LC3A was used as a model for a POI due to its potential as handle for degrader development1. Using known peptides binding to LC3A, a high-throughput-compatible assay setup was established which allows the detection of > 100,000 data points per day using the PHERAstar FSX plate reader equipped with a plate stacker.
Assay principle
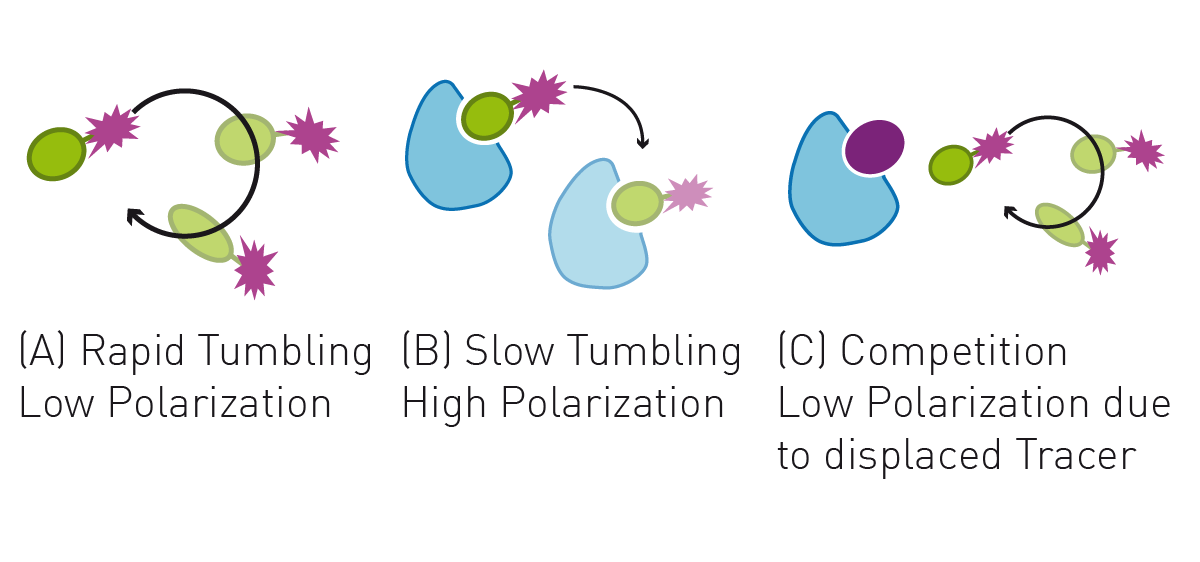
The fluorescence polarization assay presented here is based on the use of a fluorescently-labeled peptide ligand (p62 LIR peptide) binding LC3A. The small freely tumbling peptide ligand displays a larger depolarization of emitted light compared to its POI-bound state, which significantly increases the complexes mass and therefore reduces the tumbling rate. The difference between these two states can be measured by the intensity of the emitted light after passing through parallel and perpendicular oriented linear polarizers.
Here, a peptide ligand of LC3A was labelled with a Cy5 fluorophore to act as a tracer molecule. Adding competing ligands of LC3A to the LC3A-tracer complex results in a displacement of tracer and a reduction of the FP signal (fig. 1). With this approach, single ligand concentrations can be used for the screening of POI competitors, while using different concentrations of ligand will yield concentration-response curves which are suitable for KI determination.
- 1536-well microplate, black (Greiner #782076)
- Cy5-labelled peptide3
- Purifi ed LC3A
- HEPES buffer (30 mM HEPES, 100 mM NaCl, 0.05 %Tween-20)
- Compound library
- PHERAstar FSX (BMG LABTECH)
Experimental procedure
For tracer KD determination, 30 nM tracer was used in protein buffer containing 0.05 % Tween-20 along with LC3A in different concentrations.
For displacement assays, 30 nM tracer was used together with 4 µM LC3A (2x KD) to ensure that the protein is present in peptide-bound state. 5 µl of this solution was transferred into black 1536-well plates using a Multidrop™ dispenser (Thermo Fisher). Compounds were added either in dose-dependent manner or as single concentrations, using an Echo® acoustic dispenser (Labcyte). The plates were centrifuged briefly and incubated for 30 min at room temperature to ensure equilibration of the samples. FP data measurements were carried out on a PHERAstar FSX.
For KI determination, the data points were plotted against the concentration and the obtained IC50s were converted to KI values using the following equation as described by Nikolovska-Coleska et al.2:
Instrument settings
|
Optic settings
|
Fluorescence polarization, Endpoint Measurement
|
|
|
Filter
|
FP 590-50 675-50 675-50 |
|
|
Gain
|
A: 1033 B:1164 |
|
|
Focal height
|
7.8 |
|
| General settings |
Number of flashes | 200 |
| Settling time | 0.1 sec | |
Results & Discussion
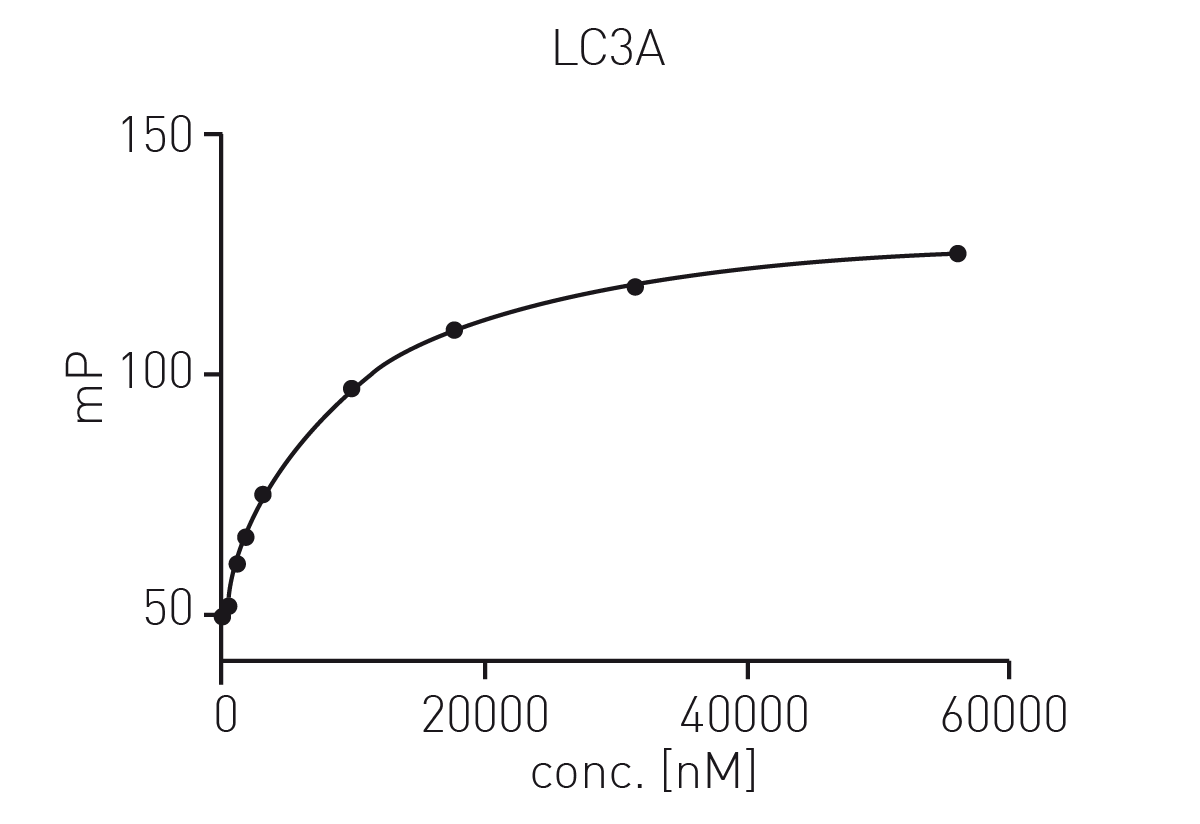
First, protein titration for KD determination was carried out using LC3A in a range from 10 nM to 50 µM and 30 nM of tracer peptide. Data were fitted using a one site exponential model (fig. 2).3
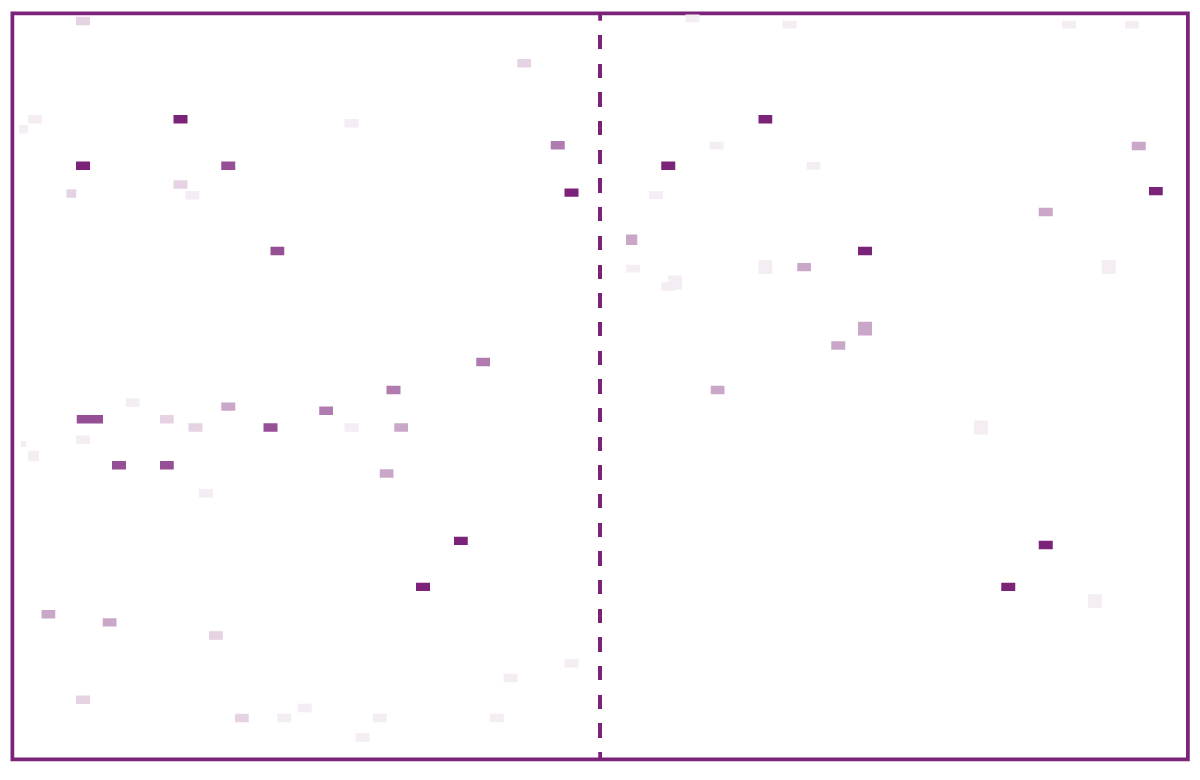
 For displacement assays, a one-shot (single concentration) compound screening was carried out in duplicate by adding 100 µM of compounds from the L1300 library. The ~7500 one-shot data points on LC3A were visualised as white-violet pixels in a heat map, so hits could be identified as violet pixels which are present in both replicates duplicates (fig. 3). Here, 100 % tracer displacement as shown by dark violet pixels corresponds to KI values of < 10 µM.3
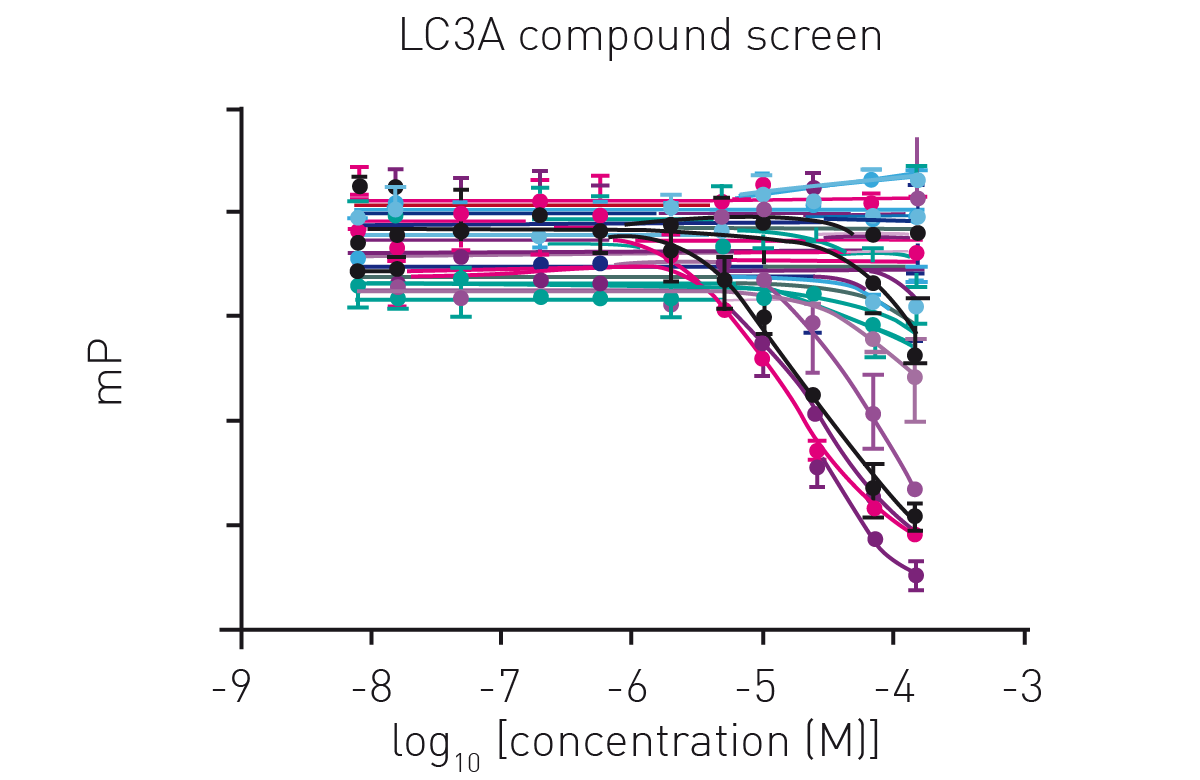
Additionally, virtual screenings were carried out followed by hit validation in dose-dependent compound screens (fig. 4).
In this approach, compounds were tested with a 11-point titration against LC3A, allowing to measure up to 64 compounds in duplicates on one plate.3
Subsequently, measured data were used to calculate compound KI values, highlighting fluorescence polarization as a versatile tool for hit identification and characterisation.
Conclusion
The fluorescence polarization assay against human autophagy modifier LC3A has been successfully miniaturised using Labcyte and BMG LABTECH technologies. The same assay format and peptide is applicable for other LC3/ GABARAP family members. This miniaturisation allowed for library screening in 1536-well plates and hence the generation of ~4600 data points per hour. Using the PHERAstar FSX plate reader together with a stacker, the throughput could be increased to ~55000 data points over night. Additionally, the assay volume could be further reduced to 5 µl due to the high sensitivity of the PHERAstar FSX. This also decreased the assay cost together with the amounts of compound used per screen significantly. In summary, this method represents the ideal cheap screening tool for proteins with a known peptide binder where libraries as big as 1 million compounds can be screened in less than 10 days.
If you are interested in more ways to evaluate PROTACs and other protein degraders, watch this webinar.
References
-
Schwalm, Martin P., Stefan Knapp, and Vladimir V. Rogov. “Toward effective Atg8−based ATTECs: Approaches and perspectives.” Journal of Cellular Biochemistry (2023).
-
Nikolovska-Coleska, Zaneta, et al. “Development and optimization of a binding assay for the XIAP BIR3 domain using fluorescence polarization.” Analytical biochemistry 332.2 (2004): 261-273.
-
Schwalm et al. “Targeting LC3/GABARAP for degrader development and autophagy modulation” manuscript in preparation.