Introduction
Glucose is central to energy consumption and serves as the primary metabolic fuel for cells of all mammals1. Accordingly, an adequate supply of glucose and the monitoring of its consumption with glucose assays is very relevant to create ideal conditions for the culture of cells.
Within the cell, glucose is metabolised into pyruvate. Aerobic conditions involve a transformation of pyruvate to acetyl-CoA, entering the citric acid cycle. Under anaerobic conditions, pyruvate is reduced to lactate, which can be associated with diverse cellular effects. Thus, lactate can also be used to monitor cellular glucose metabolism.2 Since lactate in cancer cells can also be derived from aerobic glycolysis, it can be used as a marker of disease as well3.
Especially in research areas like cancer, diabetes, neuroscience, and immunology the investigation of glucose metabolism is of growing interest. Therein diagnostic and particularly drug screening approaches set the demand for plate-based glucose assay formats that enable their analysis in high throughput. In this application note we describe the performance of the lactate and glucose assays Lactate-GloTM and a Glucose-GloTM on the VANTAstar plate reader.
Assay Principle
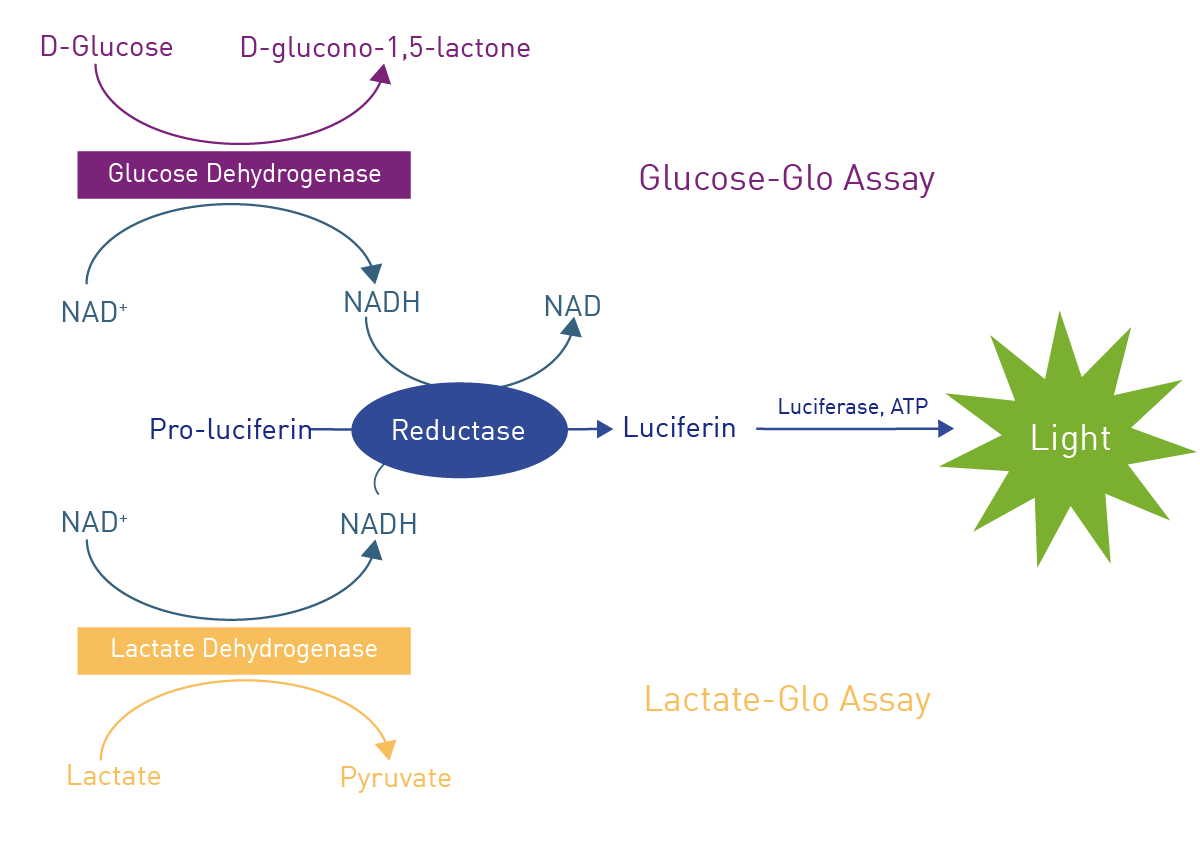
The glucose detection reagent of the glucose assay contains glucose dehydrogenase (GDH), NAD+, reductase, reductase substrate (pro-luciferin) and luciferase (fig. 1). If a test sample used for the glucose assay contains glucose, the GDH catalyses the oxidation of glucose with concomitant reduction of NAD+ to NADH. Next, the resulting NADH works as a co-factor for the reductase to convert the substrate pro-luciferin to luciferin, which is in the following used by the luciferase to produce light. The resulting luminescent signal of the glucose assay is proportional to the amount of glucose present in the sample. The lactate assay follows the same principle but uses a lactate dehydrogenase instead of GDH.
Materials & Methods
- TC-treated 384-well plate, transparent (#CLS4681, Corning)
- HeLa cell line (ACC 57, DSMZ)
- DMEM phenol red-free, low glucose, with 10% FBS, 2 mM glutamine, and 1% pen/strep (all Thermo Fisher)
- Incubator with 37°C, 5% CO2 and humidity control
- Glucose-Glo and Lactate-Glo (#J6021, #J5021, Promega)
- 384-well plate, white, med.-binding (#781075, Greiner Bio-One)
- VANTAstar microplate reader (BMG LABTECH)
Cell culture
Cells were seeded in transparent 384-well plates with 2,000 - 6,000 cells per well in 80 µL medium, with six replicates each. After 6, 24, 48 and 72 h of incubation, conditioned medium (CM) was collected (2 µL per well) to perform the lactate and the glucose assay, respectively.
For the starvation experiment, 250 cells per well were seeded and cultured for 72 h. After obtaining fresh medium for 8 h, half of the wells were then cultured in starvation medium (w/o glutamine, w/o serum) over night after two previous washing steps with PBS, while the other half received regular growth medium. The next day, medium of all wells was replaced with regular growth medium and 2.5 µL CM were collected 6, 24, and 48 h after the medium exchange for the use in lactate and glucose assays. CM samples were prediluted in PBS to 1:20, and stored at -80°C until analysed with the lactate and glucose assays.
Glucose-Glo and Lactate-Glo assays
At the day of the analysis CM samples were further diluted to 1:100 in PBS. 12.5 µL of these dilutions were transferred to the wells of a white 384-well plate. 12.5 µL glucose assay reagent or 12.5µL lactate assay reagent (prepared according to the kit’s manual) were added per well, respectively. The plates for the lactate and the glucose assay were transferred to the microplate reader, shaken for 60 s at 300 rpm, and incubated for 60 min at room temperature until read using the following settings:
Instrument settings
|
Optic settings
|
Luminescence, endpoint
|
|
|
No filter
|
||
|
General settings
|
Interval time
|
1.0 s
|
|
Settling time
|
0.1 s
|
|
|
Focal height
|
11.0
|
|
|
Dynamic Range
|
EDR
|
|
The VANTAstar automatically applies the ideal focal height and moves the aperture spoon into the light path, thereby reducing crosstalk light from non-target wells. The EDR function furthermore avoids saturation and ensures that each well is read with optimal gain settings for highest sensitivity.
Results & Discussion
While at the 6 h timepoint, glucose concentrations remained comparable between samples with different cell seeding numbers, a faster decrease of remaining glucose became obvious in the approaches with higher cell numbers after 24 h (fig. 2A). According to results of the glucose assay, in 6,000 cell samples, almost all glucose was consumed after 48 h while in lower cell number samples, this state was only reached after 72 h. Inversely to the glucose assay, the lactate assay indicated an increase of lactate concentration over time (fig. 2B). While lactate levels were comparably low in all approaches after an incubation of 6 h, they started to increase faster in samples with higher cell seeding densities.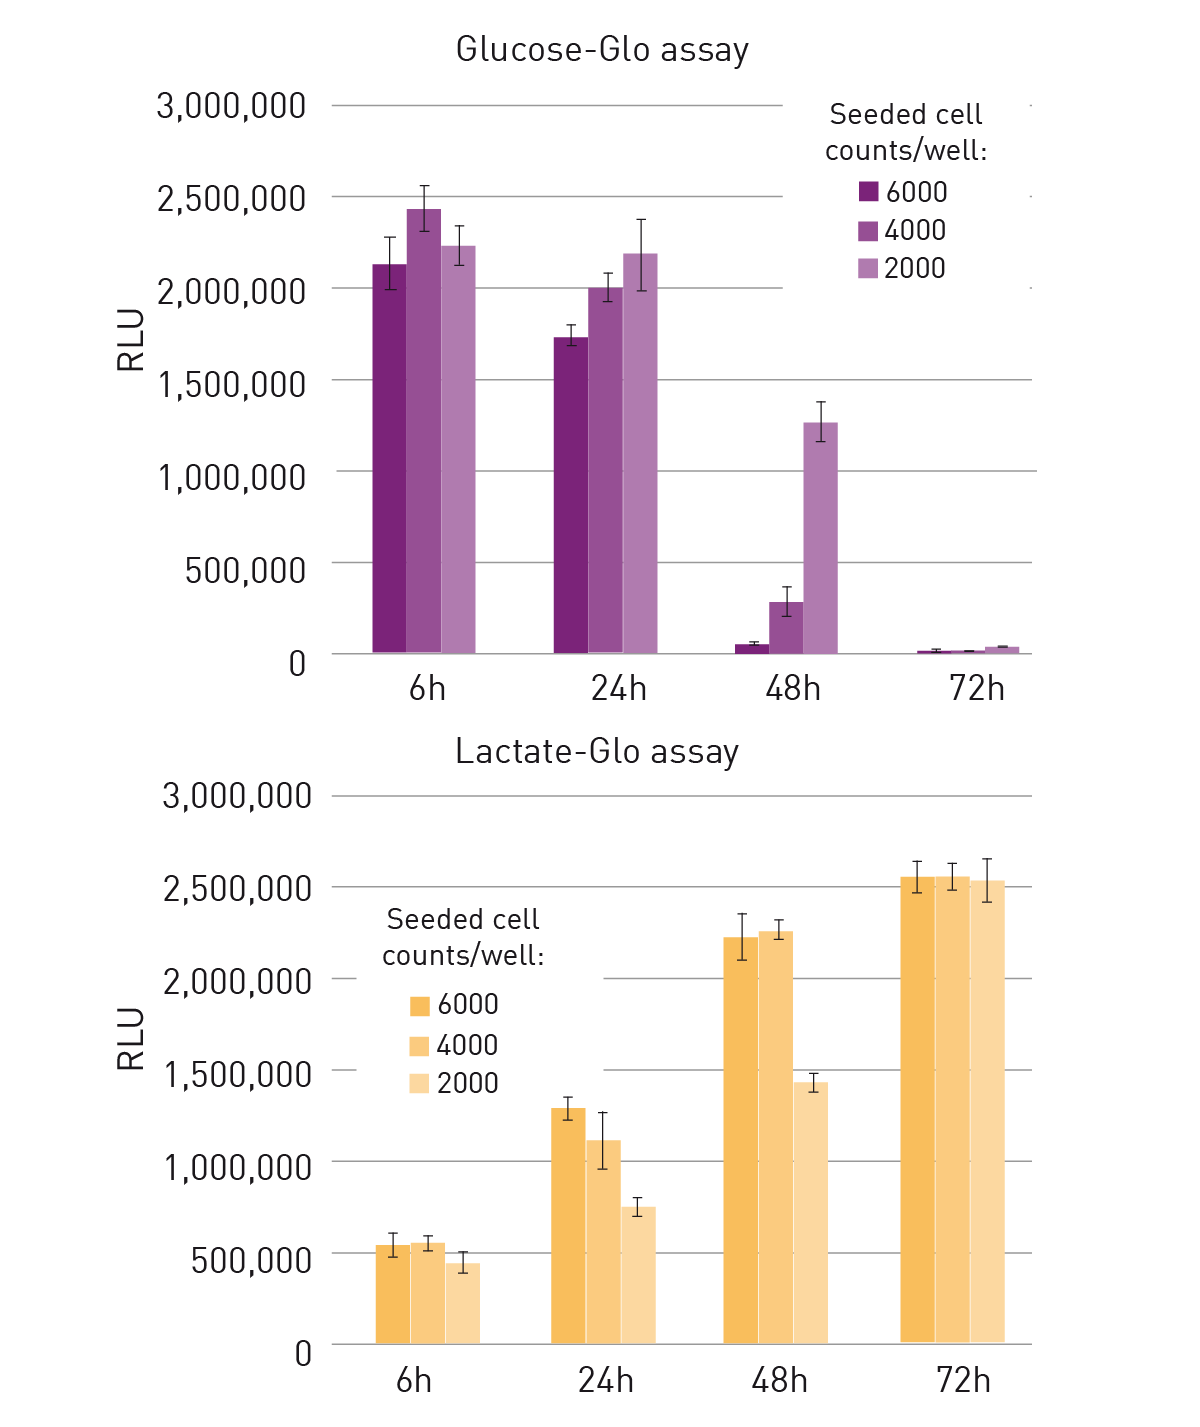 When comparing starved and non-starved cell cultures of the same seeding density with the glucose assay, it could be seen, that starvation led to a decrease in glucose consumption and accordingly, to higher remaining glucose levels (fig. 3A). This also corresponded with a slower release of lactate in starved CM samples (fig. 3B).
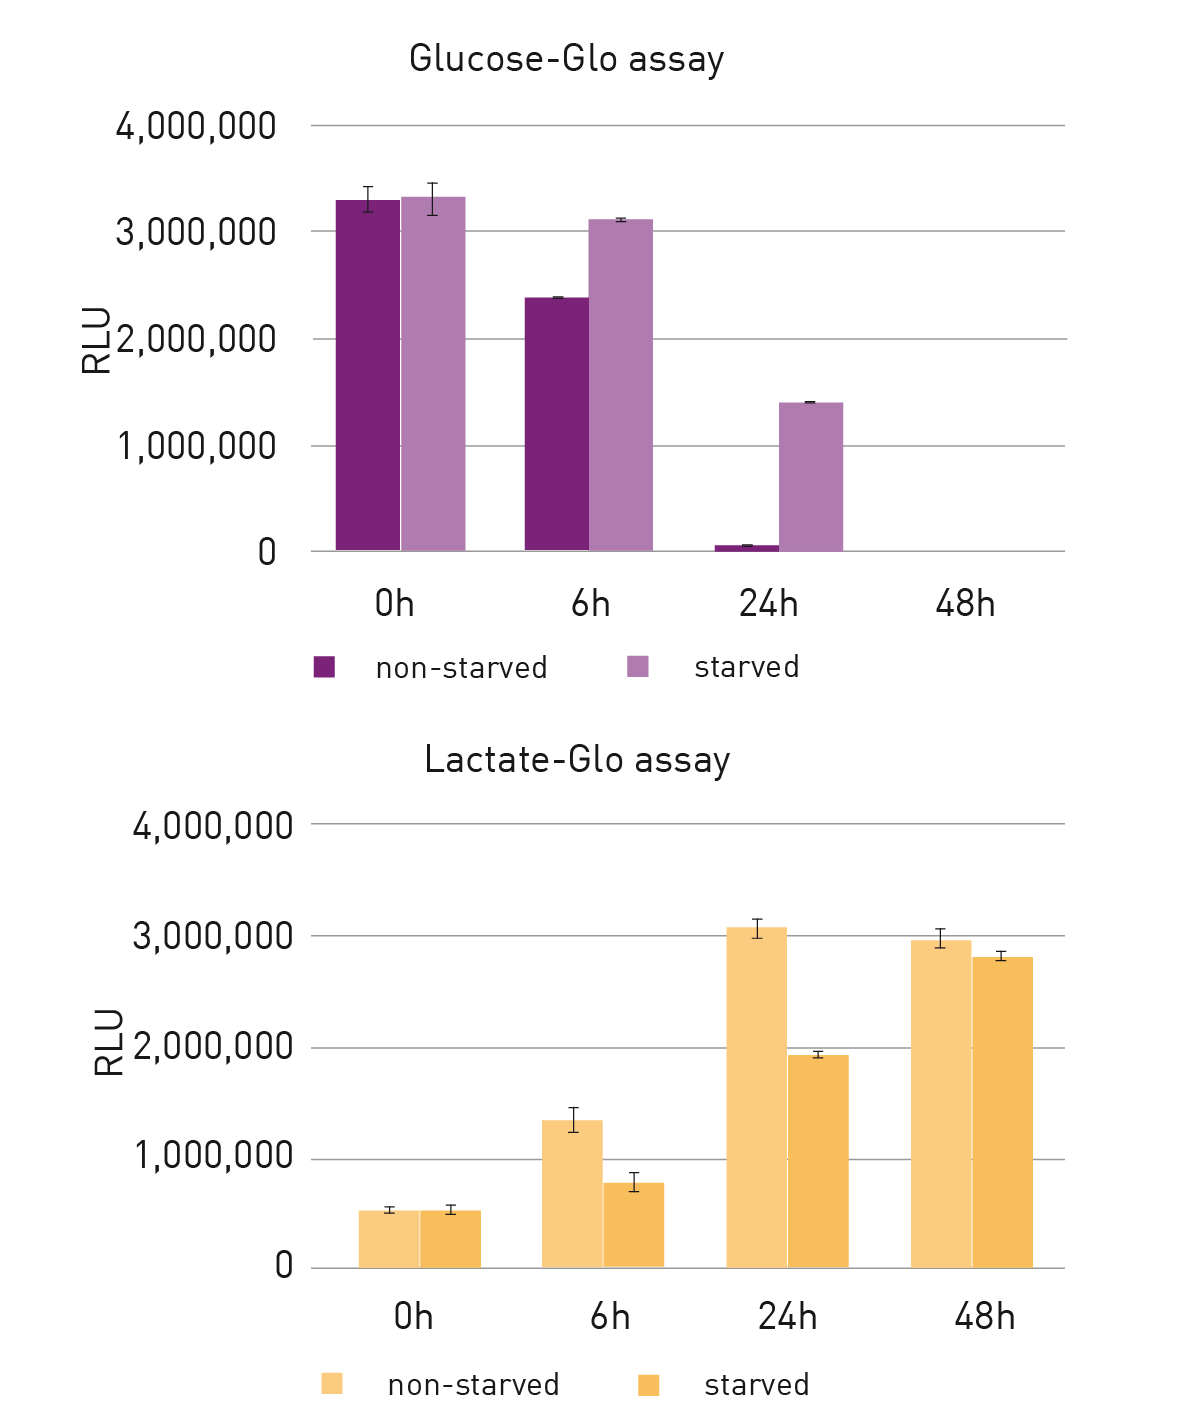
Conclusion
The lactate and glucose assay from Promega have been successfully miniaturised and read on the VANTAstar. Automatic crosstalk reduction using the aperture spoon and identification of the optimal focal height did not require any action from the operator. The enhanced dynamic range feature guaranteed the selection of a suitable gain for each sample individually. Thereby, saturation of the detector was avoided, even with a strong increase of the luminescence signals during the incubation time of the lactate and the glucose assay. The VANTAstar represents an ideal tool to measure luminescence assays with maximum ease of use.
References
- Nakrani MN, Wineland RH, Anjum F. Physiology, Glucose Metabolism. In: StatPearls. Treasure Island (FL): StatPearls Publishing; 2022 Jan-; https://www.ncbi.nlm. nih.gov/books/NBK560599/
- Chaudhry R, Varacallo M. Biochemistry, Glycolysis. 2022 Aug 15. In: StatPearls [Internet]. Treasure Island (FL): StatPearls Publishing; 2022 Jan–.
- Jiang B. Aerobic glycolysis and high level of lactate in cancer metabolism and microenvironment. Genes Dis. 2017 Feb 14;4(1):25-27. doi: 10.1016/j.gendis.2017.02.003.