Introduction
Antioxidants prevent the accumulation of reactive oxygen species (ROS) in cells. Antioxidants are compounds with a high benefi t recognized in the cosmetics, pharmaceuticals and agro-food industries. For decades, in vitro studies were limited to cell-free test tube assays such as ORAC, TRAP, FRAP, etc. Available cellular antioxidant assays usually use dichloro dihydro fluorescein diacetate (DCFH-DA) which requires chemical molecules or UV light as ROS inducers. They do not allow to monitor the level of ROS produced by the cell and cannot discriminate between antioxidant and cytotoxic effects.1 Based on the LUCS assay initially developed to measure cytotoxicity, the AOP1 assay is a live cell antioxidant approach that allows assessing the free radical scavenging capacity of antioxidants in a quantitative manner.
Assay Principle
AOP1 Antioxidant assay
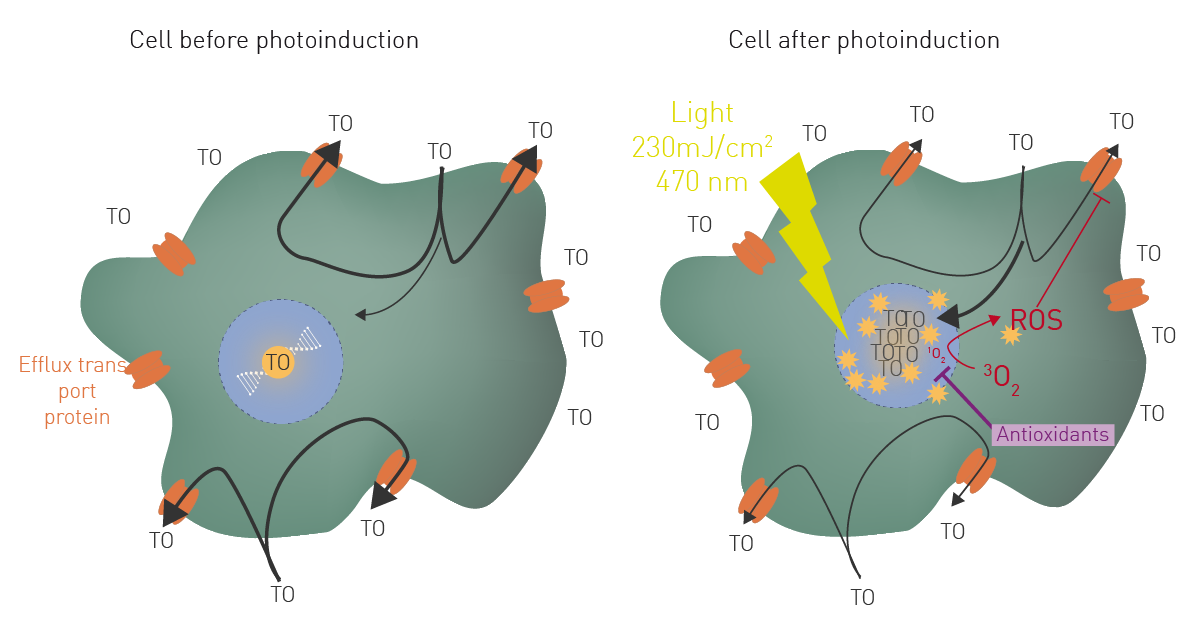
The fluorescence of photosensitizer thiazole orange (TO) is known to increase by 500 times when it reaches nucleic acids in cells2. If TO passively enters into living cells in homeostasis, it is quickly removed by efflux transport proteins, resulting in a low fluorescence level (fig 1A). Once activated with a LED flash light, TO acts as a classical photosensitizer, producing ROS (at least 1O2 and OH·) in the vicinity of its targets3. Elevation of ROS inside the cell in turn affects efflux function. TO then accumulates inside the cell resulting in a high fluorescence level (fig. 1B). This process, called LUCS (Light Up Cell System) allows a very fine monitoring of intracellular ROS production and can be employed to quantitate antioxidants. Antioxidant activity will maintain low fluorescence or evoke a delay in its increase.
 LUCS Viability assay
This photoinduction process can also be applied in a different protocol to measure cell viability. In homeostatic cells, low fluorescence (Fpre) is maintained due to functional efflux proteins but as soon as light is applied at an appropriate level, efflux function is lost, and Fpost increases (Fpost>>Fpre). In damaged cells, efflux functions do not work anymore (Fpost ≈ Fpre). In dose-response studies, Fpost/Fpre ratios allow to calculate e.g. EC50.
Materials & Methods
- HepG2 cells (HB8065, ATCC)
- DMEM high glucose, Glutamax, pyruvate and P/S (all Gibco) FBS and Trypsin EDTA (Thermo Fisher Sc.)
- 96-well plate (Costar)
- Quercetin and chloroquine (Sigma Aldrich)
- AOP1 and LUCS kits (K-1001/K-2001, AOP)
- LED array system (LEDA-470, Teleopto)
- CLARIOstar Plus (BMG LABTECH)
Experimental procedure
HEPG2 cells were cultured until confluence of 70-80% was reached. They were then seeded in clear 96-well plates with 75,000 cells/well in 75 µL and cultured for 24 h. The antioxidant assay (AOP1) and the cytotoxicity assay (LUCS) were performed as dose-response studies in serum-free medium.
AOP1 Antioxidant assay
Cells were treated with nine different concentrations of quercetin (1.95-500 µM) or with 1% DMSO (neg. ctrl.) and incubated for 4 h. Solution A from the K-1001 AOP1 kit was added and incubated as indicated in the datasheet. The fluorescence intensity (FI) was read in the CLARIOstar Plus before (flash 0) and after each flash (1-20 flashes, 10 sec each) with a LED array system, placed outside the reader (fig. 2).
Instrument settings
| Optic settings |
Fluorescence intensity, plate mode kinetic |
|
|
Monochromator |
Ex 503-16 |
|
|
General settings |
Number of flashes |
20 |
|
Settling time |
0.5 sec |
|
|
Kinetic settings
|
Antioxidant assay (AOP-1) | |
| Number of cycles | 20 | |
| Cycle time | 120 sec | |
| Cytotoxicity assay (LUCS) |
||
| Cycle time | 300 sec | |
| Number of cycles | 8 (2 in routine) | |
|
Focal height |
3.5 | |
|
Gain |
EDR (auto-gain) | |
Cytotoxicity assay
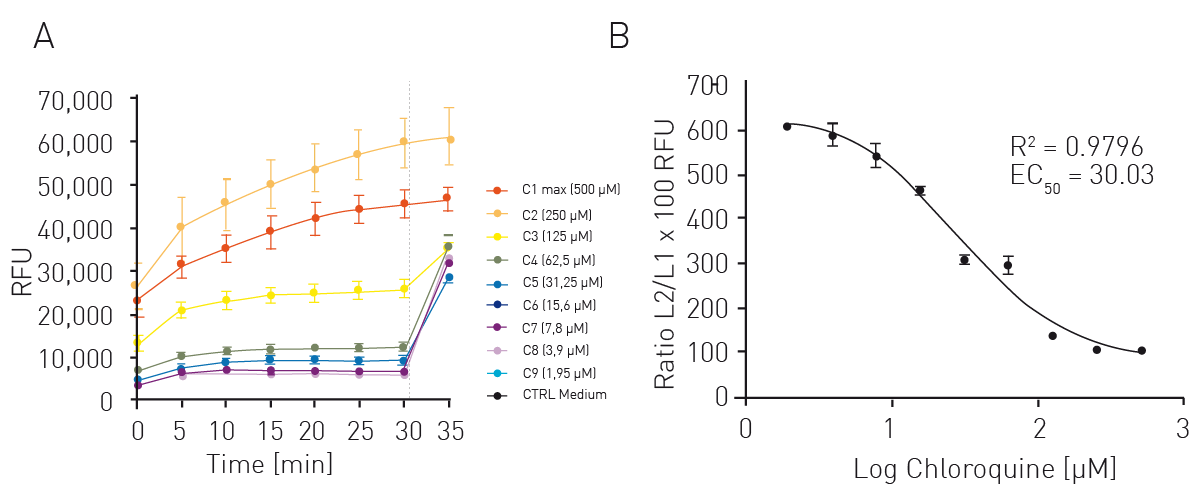
Cells were treated for 24 h with nine different concentrations of chloroquine (1.95-500 µM) or with medium (neg. ctrl.). Solution A from the K-2001 LUCS kit was added and incubated as indicated in the datasheet. FI was measured in the CLARIOstar Plus every 5 min for a total of 30 min. Cells were then illuminated for 10 sec with the LED array system and FI was measured one more time. Routine use requires only 1 pre-illumination (Fpre) and 1 post-illumination (Fpost) reading to calculate the ratio.
Results & Discussion
For the AOP1 assay, relative fluorescence units (RFUs) were plotted in a kinetics-like mode (not shown). Data were then normalised to DMSO control value (fig. 2A). Antioxidant indices (AI, fig. 2B) correspond to control AUC (Area Under Curve) minus sample concentration AUC normalised to control value. Data were fitted to a sigmoid regression model and plotted as function of the log of quercetin concentration. An EC50 of 5.83 µM was obtained which is in line with the literature.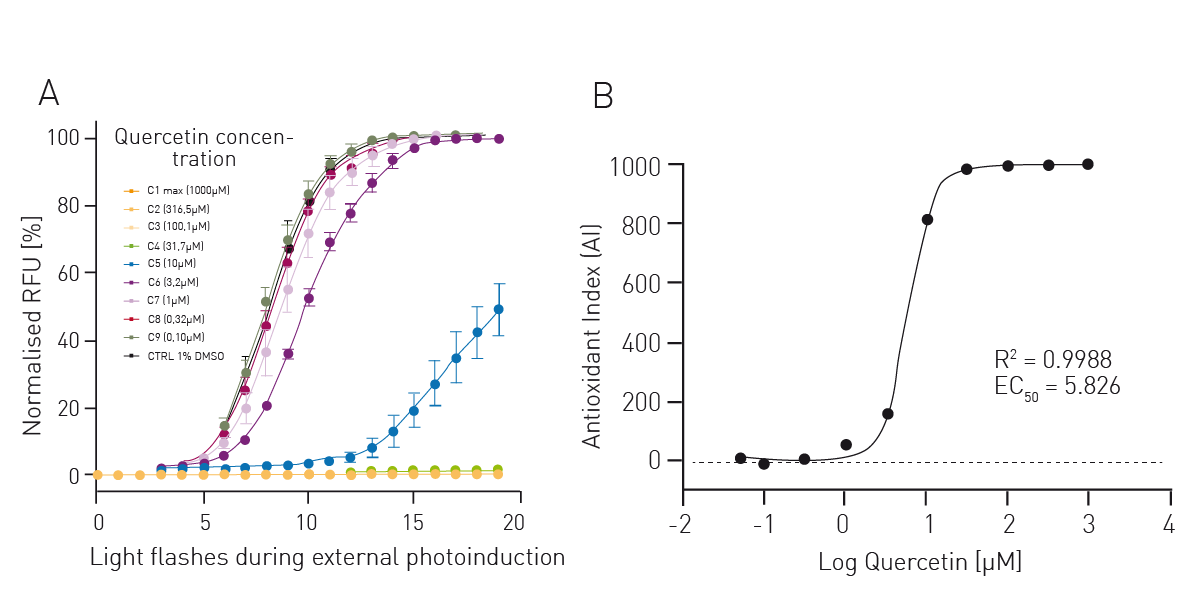 For the LUCS viability assay RFU were directly plotted as function of time (fig. 3A). The dotted line represents the illumination step. The ratios of fluorescence levels before (Fpre) and after (Fpost) illumination were calculated for each curve, then fitted to a sigmoid regression model and plotted as function of the log of chloroquine concentration (fig. 3B). An EC50 of 30.03 µM was obtained which is in line with the literature4.
Conclusion
The LUCS technology implemented in the AOP1 antioxidant assay and the LUCS viability assay is a promising alternative to classical approaches. It comes with many advantages like its applicability in a great diversity of living cells, the option to discriminate between antioxidant effects and cell viability, and its compatibility with multiplexing approaches.
By its ability to connect both illumination steps and fluorescence readings in a unique protocol, the CLARIOstar Plus has become the first microplate reader able to fully integrate AOP1 and LUCS assays in a “plug-and-play“ configuration, adapted to routine and HTS applications.
References
- Furger C., Live Cell Assays for the Assessment of Antioxidant Activities of Plant Extracts. Antioxidants (Basel). 2021 Jun 11;10(6):944. doi: 10.3390/antiox10060944.
- Nygren J, et al., The interactions between the fluorescent dye thiazole orange and DNA. Biopolymers. 1998 Jul;46(1):39-51. doi: 10.1002/(SICI)1097-0282(199807)46:1<39::AIDBIP4>3.0.CO;2-Z.
- Derick S et al., LUCS (Light-Up Cell System), a universal high throughput assay for homeostasis evaluation in live cells. Sci Rep. 2017 Dec 22;7(1):18069. doi: 10.1038/s41598-017-18211-2.
- Gironde C, Dufour C, Furger C. Use of LUCS (Light-Up Cell System) as an alternative live cell method to predict human acute oral toxicity. Toxicol Rep. 2020 Feb 19;7:403-412. doi: 10.1016/j.toxrep.2020.02.010. PMID: 32140424; PMCID: PMC7047139