Introduction
Vascular endothelial growth factors (VEGF) are proteins that act as dimers to mediate angiogenesis by binding to their cellular receptors (VEGFR). Upon ligand binding VEGFRs dimerize and initiate a raft of signaling cascades via their intracellular tyrosine kinase domains. VEGFs and their receptors play a role in tumor vascularization and are major targets of anti-cancer therapies.
In order to characterize affinities of VEGF isoforms binding to VEGFR2, binding assays are required that quantitatively and kinetically report on these interactions and allow to evaluate their binding kinetics.
A novel labeling technique stoichiometrically labels the VEGF family member VEGF165a with the fluorophore TMR. The modified ligand was used in conjunction with NanoLuciferase-coupled VEGFR2 (NLuc VEGFR2) in a cellular NanoBRET assay.
Assay Principle
VEGF165a was expressed as a HaloTag fusion protein that upon secretion was captured on Halolink resin. The tag was proteolytically removed by HaloTEV and in the presence of 6-TMR-PEG-CBT resulting in the ligand labelled with TMR at a single N-terminal cysteine (Fig. 1A)
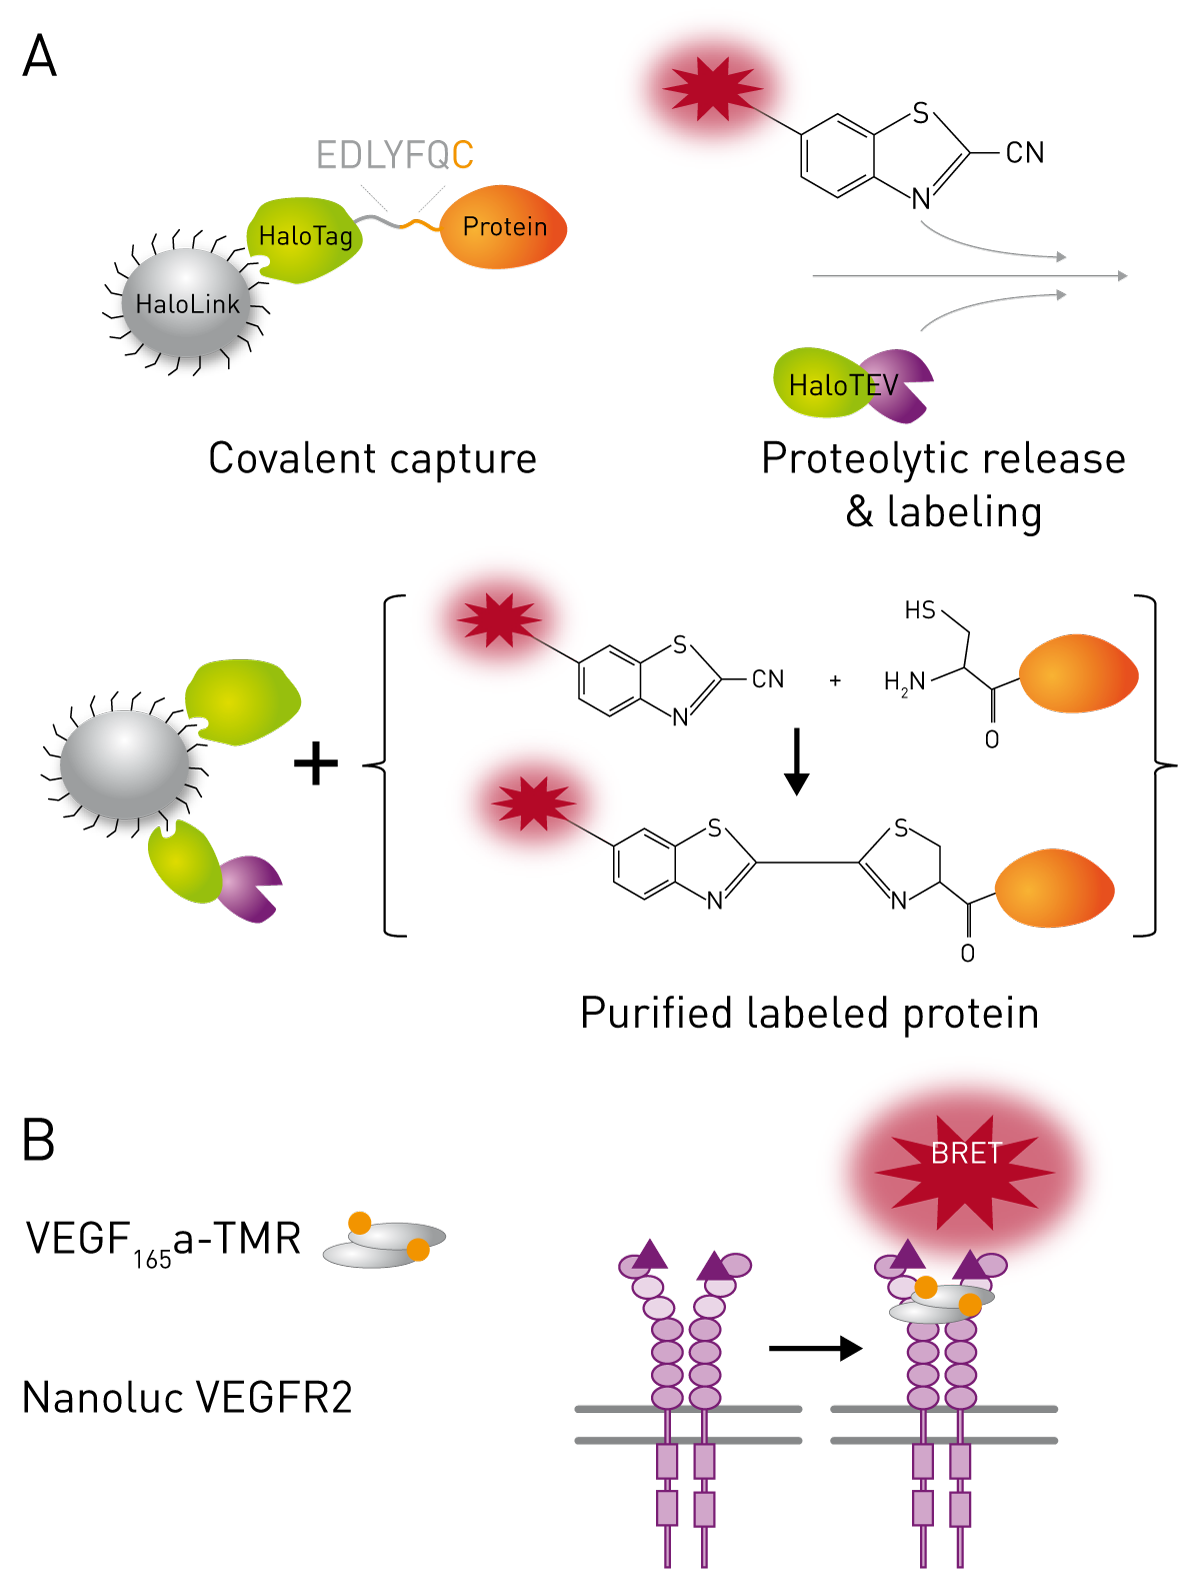 The binding of the VEGF165a-TMR homodimer to NLuc fused VEGFR2 was detected using BRET. Briefly, oxidation of the NLuc substrate furimazine produces energy which can be transferred from the bioluminescent donor (NLuc) to the acceptor flurophore (TMR) if the two proteins are in sufficiently close proximity (<10nm). Hence, the ratio of fluorophore to luciferase emission indicates interaction of fluorescent ligand with its cognate receptor (Fig 1B).
Materials & Methods
- White flat bottomed microplates (Greiner Bio-One #655098)
- PHERAstar® FS
- Furimazine (N1130, Promega Corporation)
- HEK293 stably expressing NLuc-VEGFR2
Experimental procedure
HEK293 cells expressing NLuc-VEGFR2 (40,000/well) were seeded 24 h prior to the experiment. Measurements were conducted in HBSS/0.1 % protease free BSA and with a furimazine concentration of 10 µM. Fluorescently labelled VEGF165-TMR, unlabelled VEGF165a, and Cediranib (an RTK inhibitor, 1 µM) were used at indicated concentrations and measurements were acquired with a PHERAstar FS microplate reader using the settings outlined below.
Instrument settings
| Optic settings |
Luminescence, endpoint or plate mode kinetic, top optic | |
| Optic module | NanoBRET; Em 1 460-80 (Nluc) Em 2 LP610 (TMR) |
|
| Gain | 2800 (Nluc) 3600 (TMR) |
|
| General settings |
Settling time | 0.0 s |
| Measurement interval | 1 s | |
| Kinetic settings |
Number of cycles | 33 |
| Cycle time | 30 s | |
| Incubation |
Endpoint | None |
| Kinetic | 37 °C | |
Results & Discussion
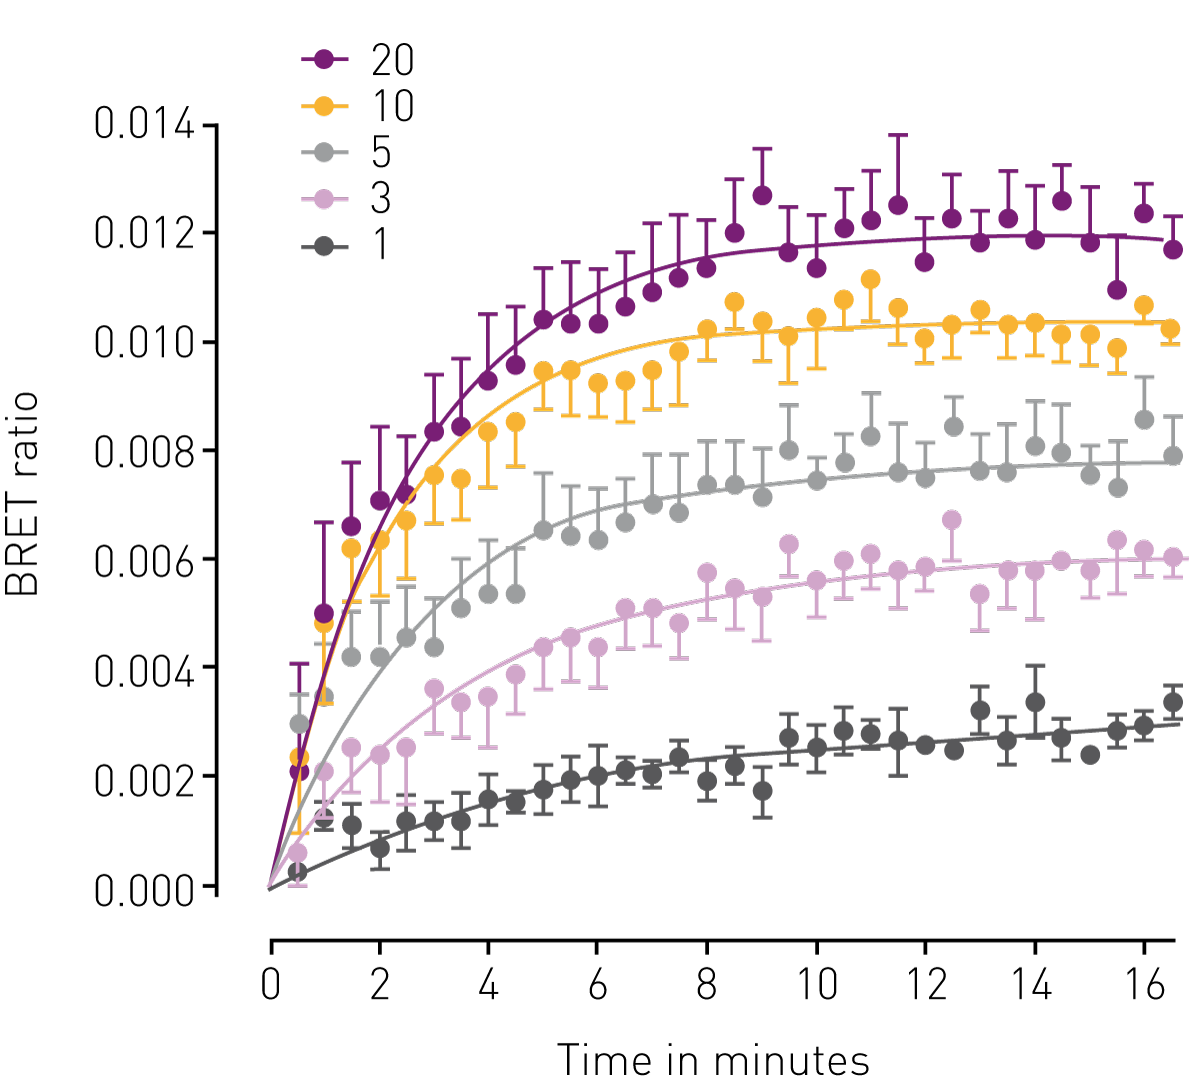
The TMR-labelled VEGF165a was added in concentrations from 1-20 nM to NLuc-VEGFR2 expressing HEK293 cells to monitor ligand-receptor interaction by NanoBRET. The time course of BRET ratios obtained shown in Figure 2 reveals the increase in binding and equilibrium of binding 10 min after the start of the reaction.
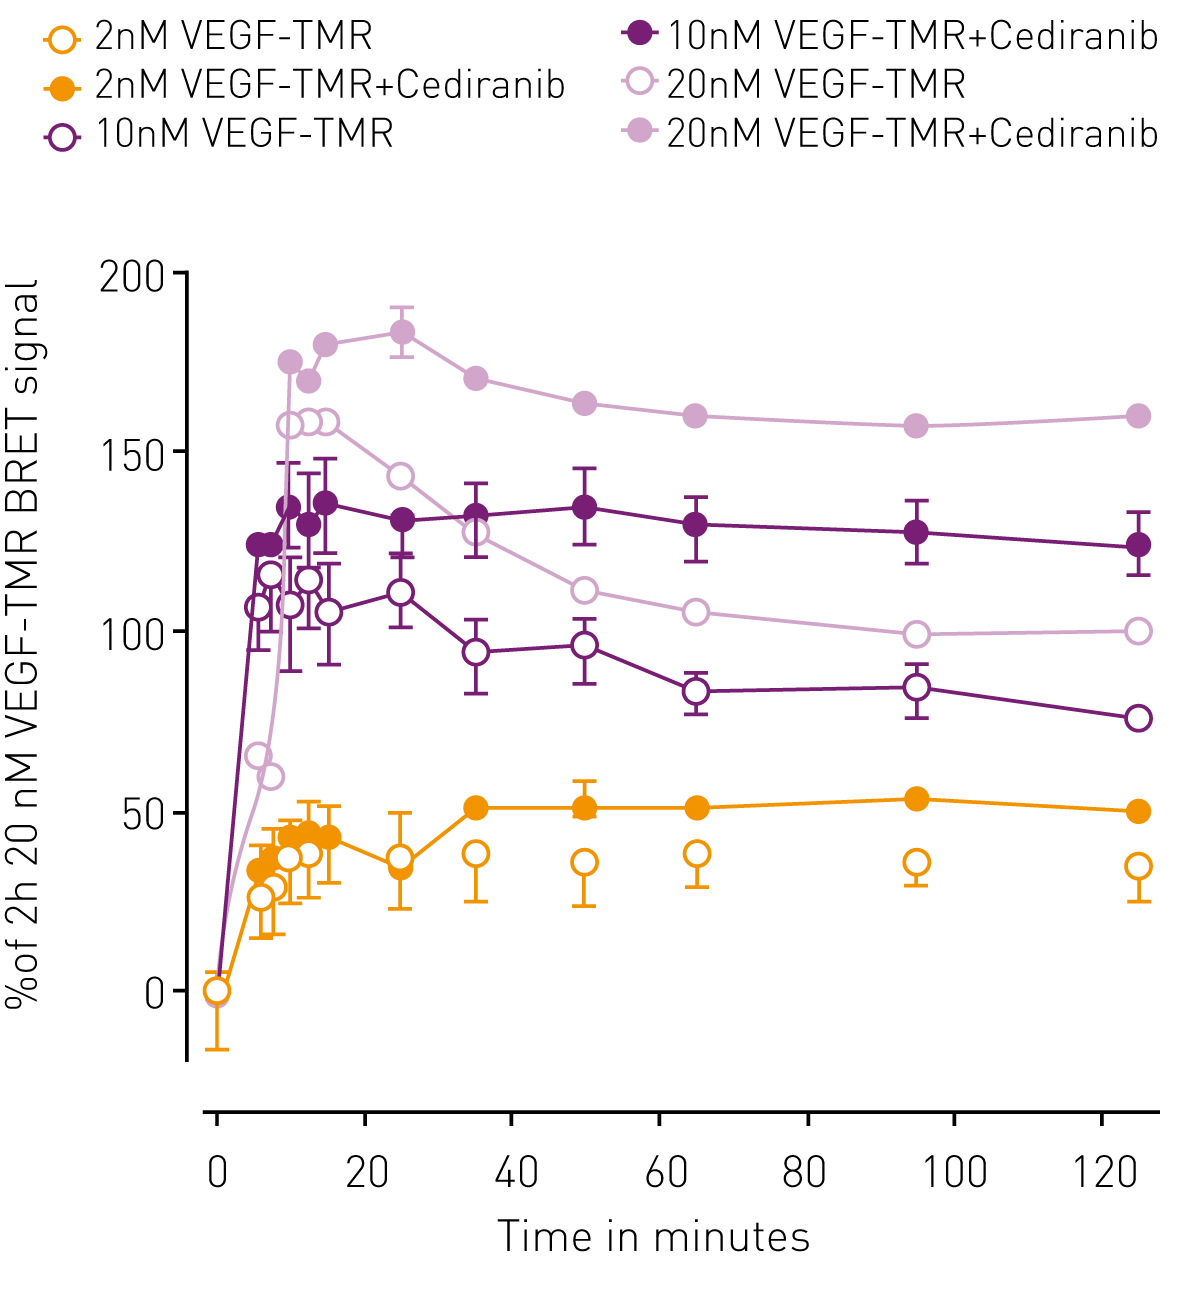
Next, the ability of the assay to determine ligand binding affinities was tested by displacement of VEGF165a-TMR binding to VEGFR2 by unlabeled competing VEGF165a. The interaction between VEGF165a-TMR and VEGFR2 was impaired by increasing concentrations of the competing isoform as reported by loss of BRET signal (Fig. 3). The pKi for VEGF165a determined by BRET was 9.81.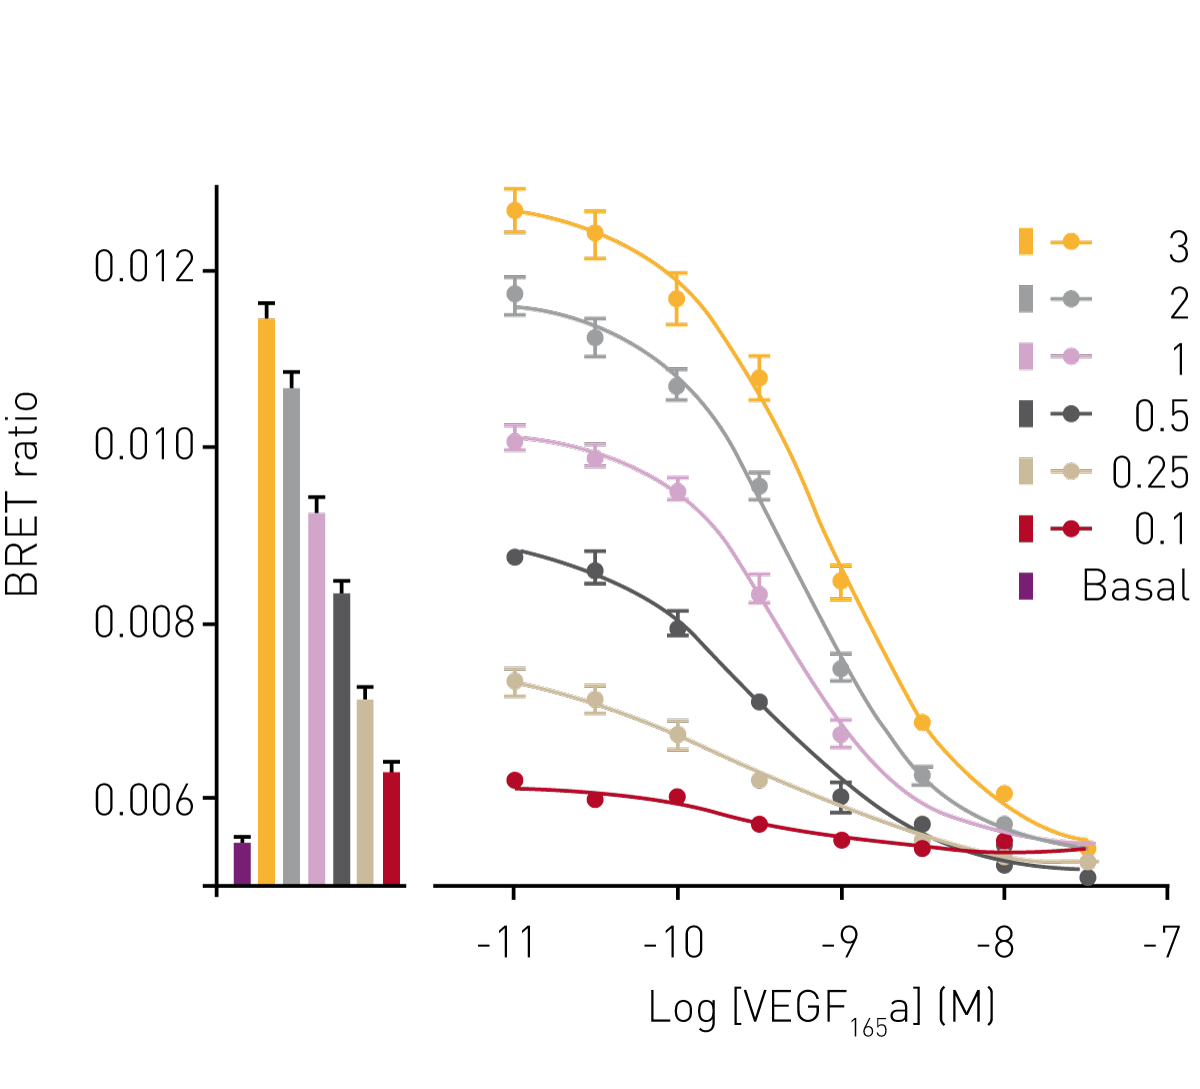 The effect of the receptor tyrosine kinase inhibitor cediranib on VEGF165a-TMR binding to VEGFR2 was monitored for 2 h. In the absence of the inhibitor, ligand bound to VEGFR2 with a peak BRET signal obtained at approximately 15 min after ligand addition (Fig. 4, empty symbols). At later time points, the BRET signal reduced because of receptor internalization and subsequent complex dissociation. In contrast, in the presence of cediranib, high BRET ratios were observed that were sustained for the period of the experiment (2hr). This was due to cediranib preventing VEGFR2 internalisation, which was later confirmed by confocal and super-resolution imaging (Kilpatrick et al., 2017 (1), Figure 7a; data not included in this report).
Conclusion
The novel method for single site labeling a ligand with a fluorophore has paved the way to use NanoBRET to quantify the molecular pharmacology of the anti-cancer target VEGFR2. The PHERAstar microplate reader reliably detected the luminescent and fluorescent signals produced. Simultaneous acquisition of both signals accelerates the reading of a plate and increases the temporal resolution.The combination of up-to-date assay and detection technology helps to better understand and target cancer-related biological events.
References
- Kilpatrick LE et al. (2017) Biochem Pharmacol. Jul 15; 136:62-75. doi: 10.1016/j.bcp.2017.04.006