PHERAstar FSX
Lecteur de microplaques HTS puissant et ultra-sensible


Le mot luminescence est composé du terme latin « lumin » (lumière) et du suffixe « -escence » (utilisé pour désigner des processus ou des changements). Il s'agit donc d'un processus au cours duquel de la lumière est émise. Par définition, la luminescence provient de sources froides et se distingue de l'incandescence, qui est l'émission de lumière à partir de sources chauffées, comme le fer chaud ou une bougie allumée.1 Les signaux lumineux peuvent être générés lors de la conversion d'une grande variété de sources d'énergie. Ce processus transforme l'énergie invisible en rayonnement visible et peut être utilisé dans la nature comme mécanisme de défense, dans les LED des écrans ou à des fins d'analyse. Cette page se concentre sur l'utilisation de la luminescence dans les sciences de la vie, explique son contexte physique, fournit des informations sur sa détection à l'aide de lecteurs de microplaques par luminescence et présente des essais courants de luminescence en microplaques. L'électroluminescence, la radioluminescence et la thermoluminescence ne sont pas abordées dans ce contenu, car elles ne sont pas pertinentes pour ce sujet.
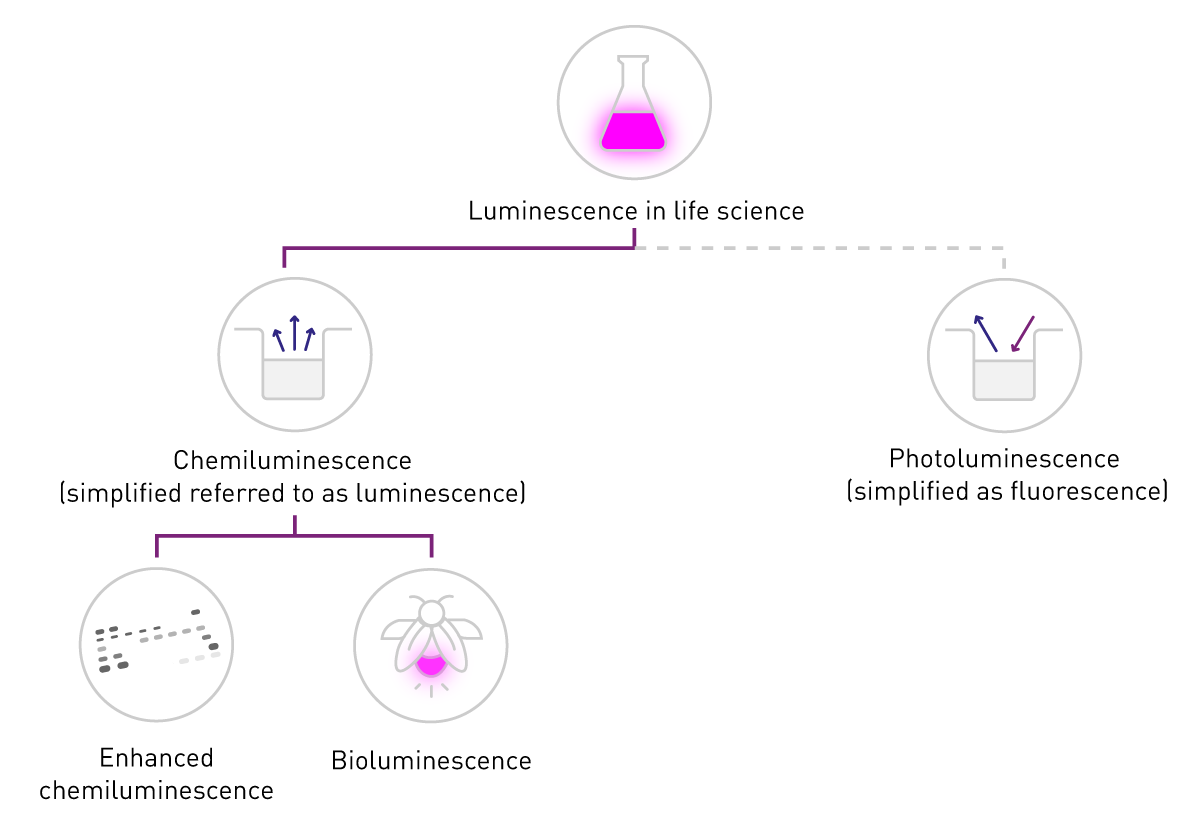
La luminescence est la production d'un signal lumineux par conversion d'énergie. Son application dans les sciences de la vie repose principalement sur deux sources d'énergie : l'énergie chimique, qui conduit à la chimiluminescence, et l'énergie lumineuse, qui conduit à la photoluminescence. Cette dernière est également à l'origine de la fluorescence (ou phosphorescence).
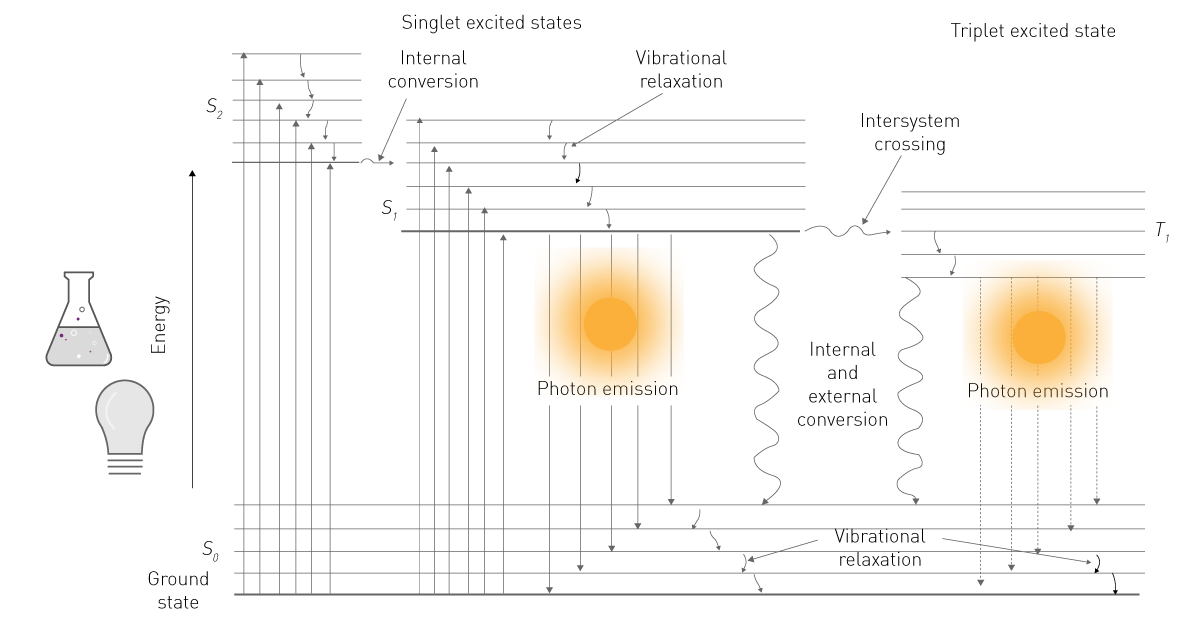
L'énergie d'une de ces sources est absorbée par une molécule, ce qui amène ses électrons à un niveau d'énergie supérieur (voir la figure 1). Ce niveau étant instable, les électrons retombent de l'état excité à l'état fondamental, libérant ainsi de l'énergie sous forme de photons. En retombant, les électrons libèrent de l'énergie sous forme d'énergie vibratoire, de chaleur et de photons. Ces derniers constituent l'émission luminescente.2
Dans les sciences de la vie, le terme « fluorescence » désigne généralement la phosphorescence ou la photoluminescence, tandis que le terme « luminescence » fait généralement référence à la chimioluminescence. Cette simplification s'appuie sur la différence de détection : la fluorescence nécessite une source d'excitation, alors que la luminescence n'en a pas besoin (voir la figure 2). Le présent document respecte cette nomenclature commune et se concentre sur la chimiluminescence, ci-après dénommée « luminescence ».
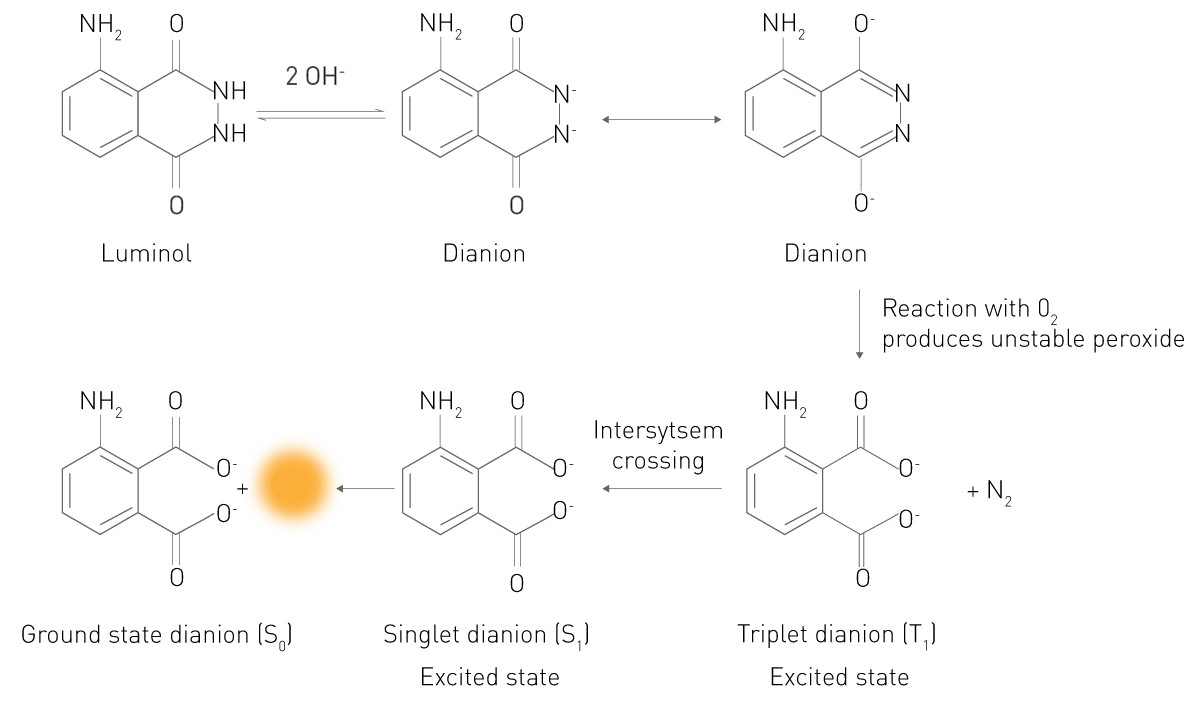
Dans cette réaction, un substrat réagit dans un état électroniquement excité. Les électrons du produit ou de l'intermédiaire excité tombent dans leur état d'énergie le plus bas en émettant des photons, ce qui provoque la luminescence. Un exemple typique est la réaction du luminol en présence de peroxyde d'hydrogène (voir la figure 3). Dans un environnement alcalin, ce substrat existe sous la forme d'un dianion qui réagit avec l'oxygène moléculaire O₂. L'intermédiaire oxydé réagit ensuite pour former de l'acide 3-aminophtalique (3-APA) excité électroniquement. La molécule retombe alors dans son état énergétique normal et émet de la lumière. Ce principe simple est également à l'origine de la chimiluminescence et de la bioluminescence améliorées. Il s'agit donc dans les deux cas de réactions de chimiluminescence.
L'ECL utilise des amplificateurs dans sa réaction de chimiluminescence. Elle utilise principalement du luminol en conjonction avec du peroxyde d'hydrogène. Cependant, l'oxydation est catalysée par une enzyme, la peroxydase de raifort (HRP). Les réactions ECL contiennent également des produits chimiques qui augmentent la production de lumière, comme l'acide p-coumarique ou l'acide 4-iodophénylboronique. L'utilisation d'une enzyme pour catalyser la réaction chimique permet à l'ECL d'être utilisée dans des réactions enzymatiques. Sa principale application est l'immunoblot : les protéines sont séparées en fonction de leur taille, transférées sur une membrane, puis détectées par l'ECL. Les protéines d'intérêt, immobilisées sur la membrane, sont liées par un anticorps spécifique. Un second anticorps couplé à la peroxydase de raifort est ensuite utilisé pour lier la protéine-anticorps à l'enzyme. Grâce aux enzymes et aux amplificateurs, un signal lumineux est alors généré uniquement à l'endroit où se trouve la protéine.
Le même principe est utilisé pour la quantification des biomolécules sur microplaques. Les tests ELISA avec lecture luminescente sont plus sensibles et utilisent l'ECL. La protéine d'intérêt est immobilisée dans un puits de la microplaque. Des anticorps spécifiques, un anticorps secondaire couplé à la HRP, un substrat et un amplificateur génèrent alors un signal lumineux dont l'intensité augmente avec la concentration de la protéine.
La bioluminescence se produit dans les organismes vivants. Ce terme désigne également les réactions utilisant des enzymes et des substrats dérivés d'organismes vivants, même s'ils sont utilisés en dehors de l'organisme ou issus de la bio-ingénierie pour en améliorer les caractéristiques. La bioluminescence est utilisée à différentes fins biologiques. Les lucioles, par exemple, utilisent leur capacité à briller pour attirer des partenaires. On pense que les méduses, comme Aequorea victoria, ou les crevettes des profondeurs utilisent la production de lumière pour repousser leurs ennemis naturels. Lors de la détection du quorum, les bactéries , telles que la bactérie marine Vibrio fischeri, produisent un signal lumineux lorsqu'elles atteignent une certaine densité. Ce signal leur permet de communiquer et de se coordonner.
Comment ces organismes parviennent-ils à produire de la lumière ? Grâce à une enzyme, la luciférase, qui catalyse l'oxydation de substrats, les luciférines, et libère ainsi des photons. Les organismes utilisent des enzymes et des substrats différents. En outre, les réactions d'émission de lumière nécessitent des cofacteurs différents et produisent des longueurs d'onde variables. La figure 4 présente trois réactions de luciférases couramment utilisées dans les essais en sciences de la vie.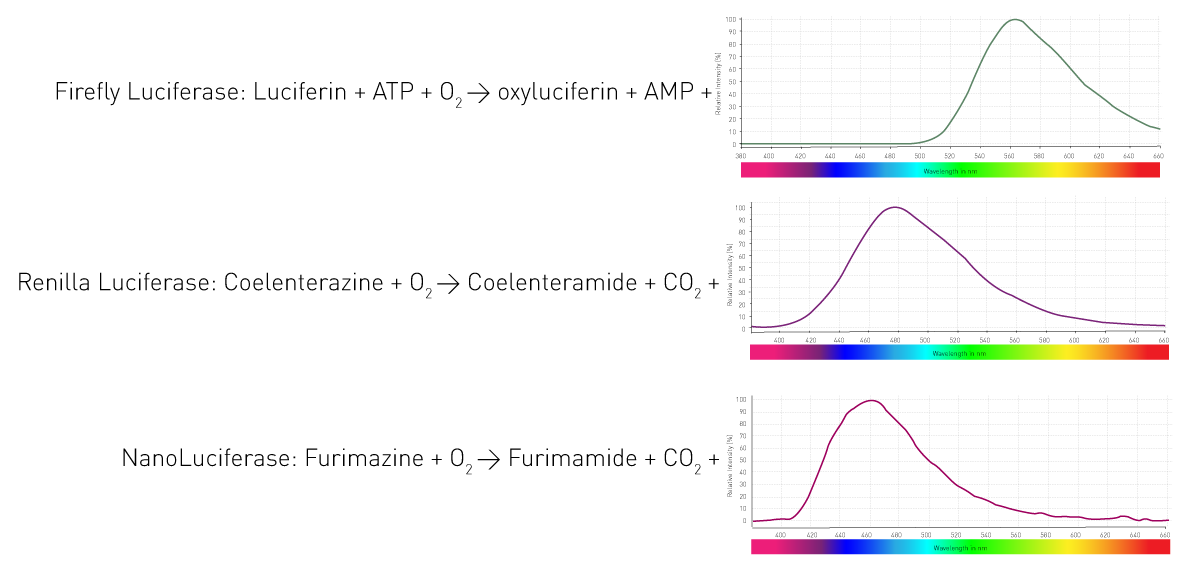
Le transfert d'énergie par résonance correspond au transfert d'énergie d'une molécule donneuse, excitée électroniquement, à un fluorophore accepteur. Ce processus excite le fluorophore accepteur, qui émet alors des photons. Si l'énergie du donneur est générée par bioluminescence, le processus est appelé transfert d'énergie par résonance de la bioluminescence (BRET). Plusieurs conditions doivent être remplies pour que le transfert ait lieu : le spectre d'émission de la molécule donneuse doit se superposer au spectre d'excitation du fluorophore accepteur. En outre, le donneur et l'accepteur doivent être proches (généralement entre 1 et 10 nm), car le transfert diminue avec la distance. Le BRET est donc couramment utilisé pour mesurer l'interaction entre deux biomolécules. Le résultat du BRET est le rapport entre l'intensité du fluorophore accepteur et l'intensité du donneur, appelé rapport BRET. Le BRET1, le BRET2 et le NanoBRET utilisent différentes combinaisons d'enzymes et de fluorophores accepteurs, comme indiqué dans le tableau 1.
Tableau 1 - Types de BRET
| Nom de la luciférase | Luciférase donneuse | Substrat | Émission du donneur | Fluorophore accepteur | Émission de l'accepteur |
| BRET 1 |
Renilla |
Coelentérazine |
450-500 nm |
YFP | 515-560 nm |
| GFP |
510-540 nm | ||||
| BRET 2 | Renilla | DeepBlueC | 400-450 nm | GFP | 500-540 nm |
| NanoBRET | NanoLuc | Furimazine | 420-500 nm | NanoBRET 618 | 550-675 nm |
| TMR | 550-600 nm | ||||
| AlexaFluor 633 | 600-700 nm | ||||
| Vénus | 515-575 nm |
Les tests basés sur la luminescence dans le cadre des sciences de la vie utilisent soit des réactions à éclat (flash), soit des réactions à rayonnement (glow). La différence entre les deux réside dans la durée du signal. Les tests flash produisent un signal pendant quelques secondes au plus. L'intensité du flash lumineux produit est généralement enregistrée du début à la fin de la réaction. Cela signifie que les réactions flash doivent être déclenchées par l'ajout d'un amorceur de réaction. Sur les lecteurs de microplaques, des injecteurs de réactifs sont nécessaires pour démarrer automatiquement la réaction et enregistrer le signal simultanément. Les tests de luminescence flash les plus courants sont la Dual-Luciferase Reporter™ ou les tests SPARCL.
Contrairement à la luminescence flash, la luminescence glow génère des signaux stables pendant des heures. Les tests ne nécessitent pas de distribution automatique et peuvent être lus sur une période plus longue. Les chercheurs et les fournisseurs de kits ont tendance à préférer les tests de luminescence glow, car ils sont plus faciles à manipuler et à détecter. Le test de viabilité CellTiterGlo® est l'un des principaux représentants de la luminescence glow.
Outre la détection ECL dans les western blots (ou immunoblot), les tests de luminescence utilisent généralement des microplaques (formats de 6 à 1536 puits) et sont quantifiés à l'aide d'un lecteur de microplaques. Cette section explique comment la luminescence est mesurée dans ces microplaques.
La luminescence est plus facile à détecter que la fluorescence ou l'absorbance, car aucune excitation n'est nécessaire. Il n'est donc pas nécessaire de disposer d'une source lumineuse ni de sélectionner une longueur d'onde d'excitation. Les composants minimaux nécessaires sont une lentille pour collecter le signal lumineux et un détecteur (voir la figure 5). Un outil de sélection de la longueur d'onde est nécessaire pour mesurer le BRET, et des guides de lumière peuvent être nécessaires pour certaines configurations de détection.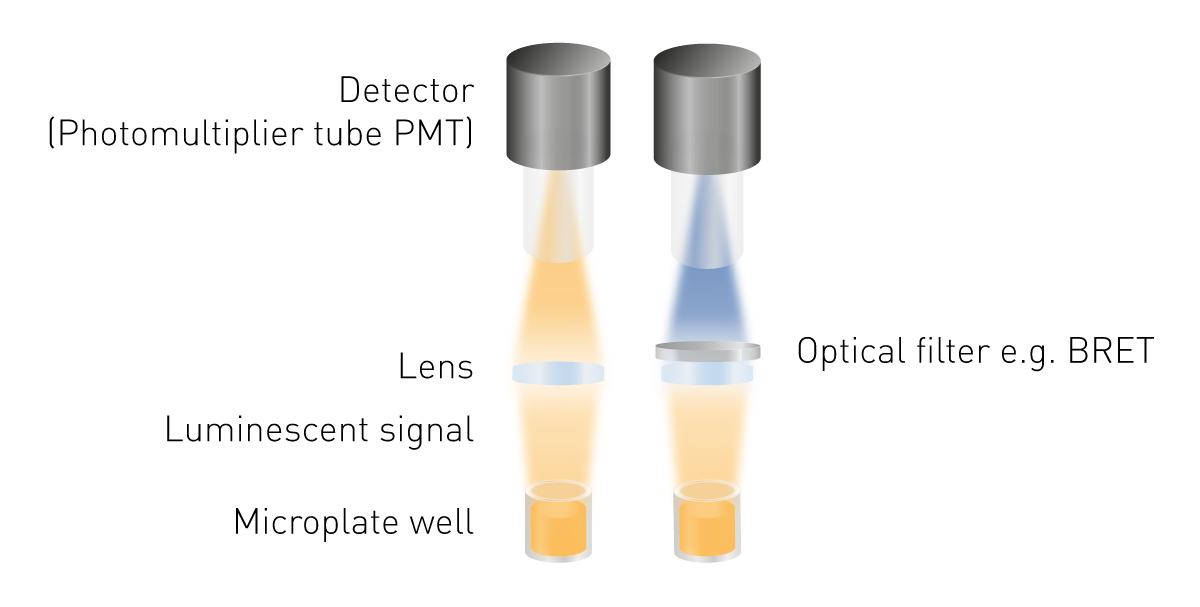
Les tubes photomultiplicateurs (PMT) sont utilisés comme détecteurs dans le cadre de la détection de la luminescence. Ils se différencient par leur sensibilité (le plus petit signal détectable), leur niveau de bruit et leur capacité à mesurer d'autres modes de détection. De nombreux appareils de mesure sont équipés d'un PMT universel permettant de lire la luminescence ainsi que d'autres modes de détection. Ils présentent l'avantage d'être peu encombrants et peu coûteux, tout en offrant une sensibilité élevée. Des systèmes optiques optimisés permettent de mesurer des signaux très faibles. Un tel système optimisé est constitué d'un chemin optique à l'air libre combiné à un module optique de luminescence, que l'on trouve dans les lecteurs de microplaques PHERAstar FSX.
Les PMT dédiés à la détection de la luminescence permettent soit de réduire le bruit, soit d'utiliser un principe de comptage de photons. Si les deux PMT dédiés peuvent tous deux détecter de faibles signaux, un système de comptage de photons est limité dans la détection de signaux plus élevés (voir la figure 6).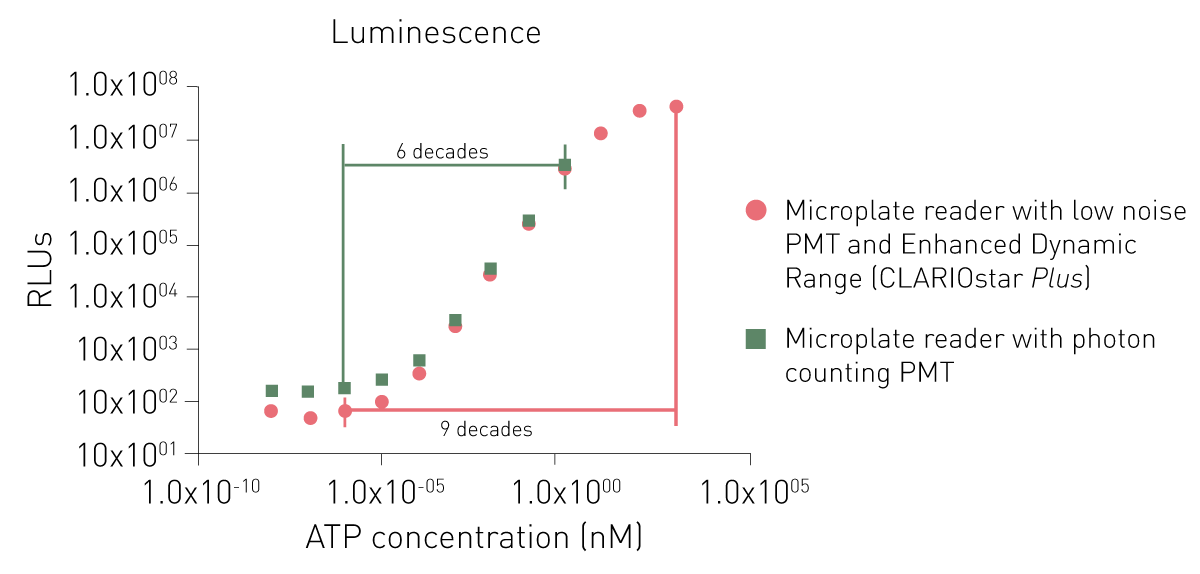
Idéalement, le détecteur est placé directement au-dessus du puits. Si ce n'est pas possible, le signal lumineux doit être guidé du puits vers le détecteur. Cette tâche peut être accomplie à l'aide de lentilles, de miroirs ou d'un guide de lumière. Le guide absorbe une partie de la luminescence, ce qui diminue la sensibilité par rapport à un chemin optique à l'air libre. Ce dernier est présent sur les lecteurs de microplaques VANTAstar, CLARIOstar Plus et PHERAstar FSX.
Certaines applications nécessitent une détection à une longueur d'onde spécifique pour obtenir des résultats optimaux. Pour ce faire, des filtres optiques ou des monochromateurs sont placés sur le trajet optique. Les mesures BRET nécessitent une sélection de la longueur d'onde car deux signaux proviennent d'un seul et même échantillon. Pour distinguer la lumière provenant du fluorophore donneur de celle provenant du fluorophore accepteur, deux filtres sont nécessaires.
Les monochromateurs conventionnels à base de réseaux jouent un rôle secondaire dans les mesures de luminescence filtrée et de BRET en raison de leur faible sensibilité. Cela est dû aux effets de diffusion et aux bandes passantes étroites. Cependant, un monochromateur utilisant des filtres variables linéaires (LVF) offre la sensibilité nécessaire. Un monochromateur basé sur des LVF présente une transmission similaire à celle d'un filtre et offre des largeurs de bande allant jusqu'à 100 nm. Cela permet de s'assurer qu'un signal suffisant atteint le détecteur pour la luminescence filtrée, comme le BRET (voir la figure 7).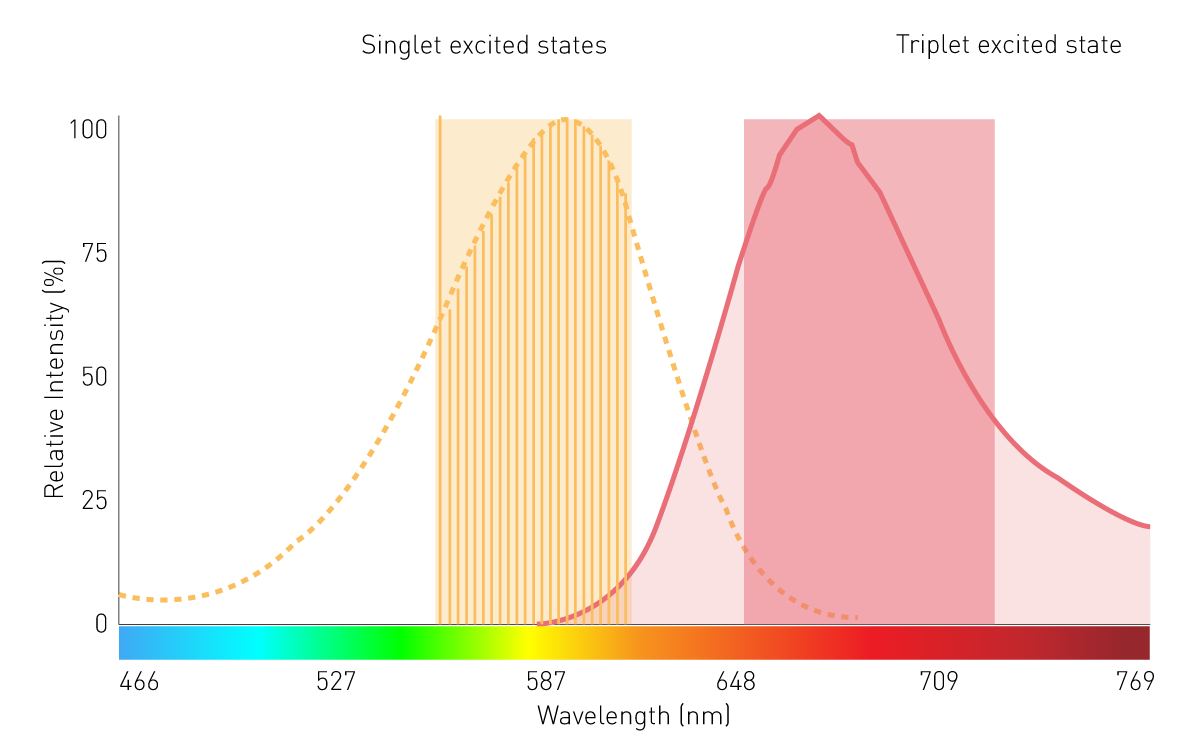
Un signal luminescent dure une seconde ou plus, ce qui le distingue clairement de la fluorescence, qui décroît en quelques nanosecondes. Le signal est donc généralement détecté sur une période de temps comprise entre 0,1 et 1 seconde. Cette période porte différents noms : le temps d'acquisition, le temps d'intégration ou le temps d'intervalle de mesure. Il dépend de plusieurs aspects qui doivent être pris en compte, tels que l'intensité du signal et le temps total de lecture d'une microplaque.
La détection de la luminescence dans les lecteurs de microplaques est relativement simple, car elle nécessite peu de réglages. Cependant, certaines variables générales et liées à l'instrument peuvent avoir un impact sur les mesures et la qualité des données.
Comme indiqué ci-dessus, le temps d'intégration ou d'acquisition dépend de plusieurs facteurs. Les aspects suivants doivent être pris en compte lors du choix du temps d'intégration :
La plupart des tests émettent suffisamment de lumière pour qu'un signal puisse être détecté en une demi-seconde, voire 0,02 seconde. Dans de très rares cas, il peut être nécessaire d'augmenter le temps d'intégration jusqu'à quelques secondes pour détecter des différences dans les signaux de luminescence.
Les signaux de luminescence sont généralement acquis pendant 0,1 à 1 seconde, car ils émettent un signal stable. Le temps de lecture total de la microplaque, ainsi que le moment et la durée de la mesure du signal, jouent donc un rôle mineur. Il en va différemment pour les essais flash. Dans ce cas, il est important de recueillir l'intégralité du signal d'émission, du début à la fin, ce qui peut prendre plusieurs secondes, en fonction de l'essai.
Pour connaître la forme de la courbe du signal et l'émission maximale d'une réaction flash, il est nécessaire d'effectuer plusieurs mesures à des temps d'intégration très faibles. Par exemple, si une réaction dure environ une seconde, 50 mesures de 0,02 seconde peuvent être effectuées pour couvrir une seconde et surveiller l'évolution et la décroissance du signal.
Ce point n'est pertinent que pour les mesures cinétiques. Lorsqu'une réaction cellulaire ou biochimique est surveillée à l'aide d'un test de luminescence, le temps d'intégration est dicté par l'évolution de la réaction. Par exemple, dans les dosages du calcium sur le site, les réponses se produisent dans une fourchette de 20 secondes après la stimulation et peuvent être représentées par 10 mesures toutes les 2 secondes. Si un seul puits est mesuré, un temps d'intégration de 1 ou 2 secondes peut être choisi, ce qui donne une résolution temporelle appropriée. Cependant, si plusieurs puits doivent être lus avec la même résolution temporelle (un point de mesure toutes les 2 secondes pour chaque puits), le temps d'intégration doit être réduit pour pouvoir mesurer les puits restants sans perdre de données.
Le temps d'intégration étant appliqué à chaque puits, il contribue largement au temps de lecture total d'une microplaque. En augmentant le temps d'intégration de chaque puits de 0,2 s seulement, le temps de lecture total d'une microplaque de 96 puits augmente de 20 s, et celui d'une microplaque de 384 puits de plus d'une minute. Il est donc important d'utiliser des temps d'intégration faibles pour les microplaques à haute densité (microplaques de 384 ou 1536 puits) et dans les applications à haut débit, où des milliers de microplaques doivent être mesurées en une journée.
Le gain peut être considéré comme un facteur d'amplification qui déplace une fenêtre de plage dynamique fixe le long de la courbe de concentration de l'échantillon. Les signaux de faible intensité nécessitent un gain plus élevé, tandis que les signaux intenses nécessitent un gain plus faible. En général, le gain est réglé de manière à obtenir une sortie de mesure maximale pour l'échantillon dont l'intensité est la plus élevée. Cela permet d'obtenir la plus grande plage dynamique possible entre les valeurs de mesure les plus élevées et les plus basses. Par conséquent, si des contrôles positifs avec un signal maximal sont utilisés pour des échantillons inconnus, le gain peut être ajusté sur ces derniers.
La possibilité de mesurer avec différents gains permet d'obtenir une large gamme dynamique et de mesurer des signaux très faibles ainsi que des émissions lumineuses avec un seul instrument.
Le réglage du gain n'est pas nécessaire pour tous les lecteurs de microplaques par luminescence, en fonction du détecteur et de l'automatisation du processus de réglage.
Les lecteurs de microplaques par luminescence modernes effectuent automatiquement les réglages de gain. Cela permet non seulement de décharger le chercheur de cette tâche, mais aussi d'assurer aux mesures une large gamme dynamique. Ces instruments sont le CLARIOstar® Plus et le VANTAstar® avec sa technologie Enhanced Dynamic Range.
Les microplaques blanches sont les mieux adaptées à la détection de la luminescence, car elles réfléchissent le signal au lieu de l'absorber. Vous trouverez plus de détails sur le choix de la microplaque dans notre article de blog : « La microplaque : l'utilité en pratique ».
Il est important de noter qu'il est préférable d'utiliser une microplaque noire si un essai luminescent et un essai fluorescent sont combinés dans le même puits. En effet, la fluorescence mesurée dans une microplaque blanche conduit à des valeurs très instables et à un signal de fond très élevé en raison de la réflexion de la lumière d'excitation. La détection de la fluorescence dans les microplaques blanches est donc très problématique. La mesure de la luminescence sur des microplaques noires réduit toutefois la fenêtre d'analyse. Toutefois, comme le bruit de fond est fortement réduit et que les écarts sont plus faibles, les résultats devraient rester satisfaisants.
Il s'agit de la lumière provenant d'un puits autre que celui mesuré, qui est détectée de manière non spécifique par le détecteur et qui modifie le signal du puits mesuré. Il s'agit d'un phénomène qui n'affecte que la détection de la luminescence.
Étant donné que la lumière produite par une réaction luminescente est diffuse, elle peut non seulement briller directement au-dessus du puits, mais aussi s'éloigner vers les puits voisins et atteindre directement le site de détection, même si un autre puits est mesuré. Cela conduit à des signaux biaisés, à des variations plus importantes et à une sensibilité globale plus faible. Le problème peut être résolu par différents moyens, en fonction du type de réaction et de la diffusion du signal.
Pour les tests flash, qui ne brillent que pendant quelques secondes, il suffit de mesurer la microplaque dans un ordre différent. Comme le signal décroît rapidement, seuls les puits adjacents sont affectés par la diaphonie lorsqu'ils sont mesurés directement l'un après l'autre. En mesurant un puits éloigné au lieu d'un puits adjacent, la diaphonie est considérablement réduite, car le signal décroissant n'est pas détectable à l'endroit éloigné. À cet effet, les lecteurs de microplaques BMG LABTECH offrent un mode de lecture entrelacé. Ce mode mesure un puits sur deux jusqu'à la fin de la microplaque. Ensuite, les zones omises sont mesurées. Les signaux mesurés en premier ont ainsi le temps de décroître jusqu'à ce que leurs voisins directs soient mesurés.
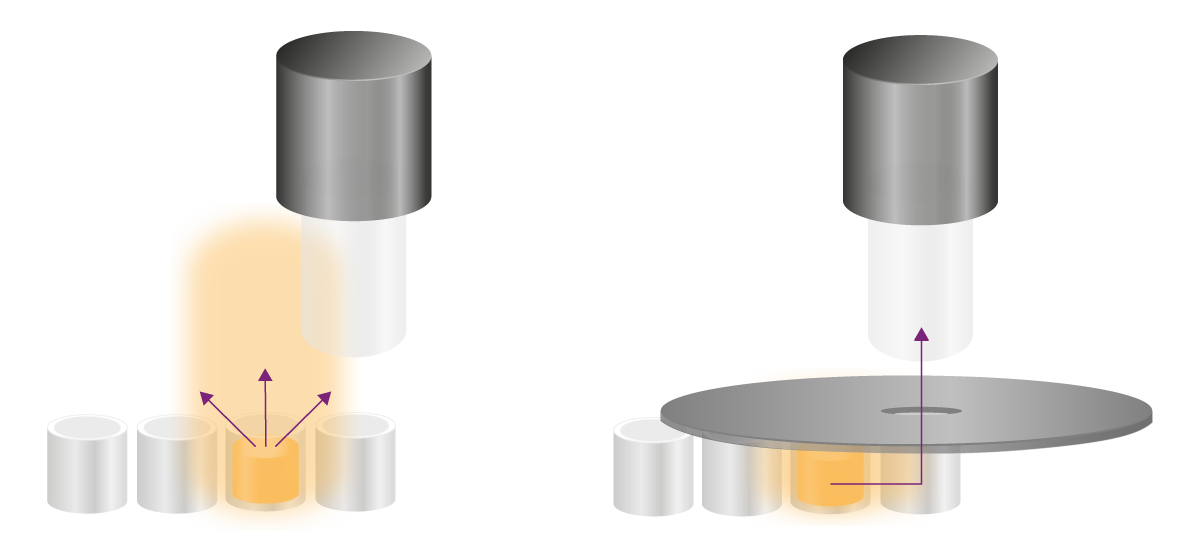
Les tests glow émettent des signaux stables pendant des heures et nécessitent d'autres stratégies pour éliminer la diaphonie. Les signaux indésirables peuvent atteindre le site de détection de deux manières : par-dessus la microplaque ou à travers la paroi des puits (voir la figure 8). Ces deux voies doivent être traitées différemment.
Les ouvertures bloquent physiquement la lumière indésirable qui pénètre dans le détecteur par les puits. Une ouverture est un accessoire noir en forme de cuillère percé d'un trou, que l'on place au-dessus de la microplaque (voir la figure 8). Le signal du puits d'intérêt atteint le détecteur à travers le trou, tandis que toute la lumière provenant de son environnement est bloquée physiquement. Les lecteurs de microplaques multimodes PHERAstar® FSX, VANTASTAR et CLARIOstar Plus de BMG LABTECH sont équipés d'ouvertures permettant d'améliorer la détection de la luminescence.
 b) La réduction de la diaphonie mathématique
La lumière peut en effet traverser la paroi en plastique d'un puits, y compris dans les microplaques blanches. Le type de microplaque a une influence considérable sur la diaphonie traversant les parois d'une microplaque. En général, les microplaques à haute densité (par exemple, 1536 puits) présentent des fuites de lumière à travers les parois plus importantes que les microplaques à faible densité, car les parois sont plus minces. Un deuxième aspect est la géométrie des puits : les puits carrés présentent une diaphonie plus importante à travers les parois, car ils sont en contact avec les puits adjacents. Les puits ronds, quant à eux, ne partagent pas de paroi et présentent donc une diaphonie plus faible. De plus, la couleur de la microplaque influence la diaphonie à travers ses parois : plus la microplaque est foncée, plus la diaphonie est faible. Les microplaques grises offrent un compromis entre la réduction de la diaphonie et la réflexion du signal.
Si l'optimisation de la microplaque n'est pas possible, une réduction mathématique de la diaphonie peut être appliquée aux données acquises. À cette fin, le débordement du signal vers les puits voisins est déterminé, puis un algorithme corrige les données. Les lecteurs de microplaques PHERAstar FSX, VANTARstar et CLARIOstar Plus de BMG LABTECH permettent de déterminer et de corriger automatiquement la diaphonie.
L'émission lumineuse de la microplaque
Les microplaques blanches présentent une phosphorescence intrinsèque : la lumière est émise par la microplaque elle-même après exposition à la lumière. Ce signal peut altérer les données en augmentant les blancs et en réduisant la fenêtre d'analyse. Il est donc recommandé de préparer la microplaque dans l'obscurité ou de la laisser dans l'obscurité pendant environ 15 minutes avant la mesure.
Les filtres sont principalement nécessaires pour les mesures BRET. Comme les signaux de sortie de la luminescence sont souvent faibles, il est recommandé d'utiliser des filtres à large bande passante, de 80 à 100 nm. Des bandes passantes plus larges permettent en effet à davantage de lumière d'atteindre le détecteur, ce qui augmente la sensibilité de la mesure.
Les tests rapporteurs combinent des séquences régulatrices de gènes à l'information génétique d'une molécule rapporteuse afin d'étudier soit le changement d'expression des gènes, soit les modifications de la région régulatrice elle-même. L'information génétique du gène rapporteur doit être introduite dans les cellules. Si le gène est actif, l'enzyme est transcrite et traduite. En présence d'un substrat, l'enzyme est convertie et de la lumière est produite, ce qui permet de rendre compte de l'activité des séquences régulatrices.
Les tests de rapporteur à double luciférase (DLR™) ajoutent un deuxième rapporteur au système. À côté de la luciférase couplée à une séquence régulatrice d'intérêt, une seconde luciférase contrôlée par un promoteur « de ménage » sert de contrôle interne. En utilisant le CLARIOstar ou le VANTASTAR et leur option de balayage de la luminescence, il est possible d'identifier les luciférases correspondantes et de combiner jusqu'à six luciférases dans un seul test multiplex de la luciférase.
Le test de viabilité le plus répandu est basé sur l'enzyme firefly. Son activité augmente avec les niveaux d'ATP, de même que l'émission de lumière. Les cellules viables produisent de l'ATP qui, après la lyse cellulaire, alimente la réaction. L'émission est donc en corrélation avec le nombre de cellules et leur viabilité. Outre les tests de viabilité basés sur l'ATP, les tests de luminescence permettent de mesurer la viabilité des cellules en temps réel. Pour ce faire, un pro-substrat et l'enzyme firefly sont ajoutés à la culture cellulaire. Le pro-substrat n'est réduit que par les cellules viables, puis est traité dans une réaction luminescente. La luminescence permet ainsi de suivre les changements de viabilité en temps réel. Pour en savoir plus sur ces tests, consultez notre exposé scientifique intitulé : « Real-time cell health assays deliver better data with less effort (Ces tests de santé cellulaire en temps réel fournissent de meilleures données avec moins d'efforts) ». Les tests de viabilité cellulaire sont également utiles dans le cadre des travaux menés avec les PROteolysis TArgeting Chimeras (PROTACs) et les colles moléculaires pour la dégradation ciblée des protéines dans le cadre de la découverte de médicaments. Ces recherches portent notamment sur la dégradation ciblée des protéines par le biais d'interactions spécifiques entre des dégrons et des ligases connus.

Le métabolisme cellulaire désigne l'ensemble des étapes de conversion moléculaire. La plupart des tests permettant de détecter les voies métaboliques cellulaires sont basés sur la luminescence. Le métabolisme de base se concentre sur l'utilisation des principaux nutriments, comme le glucose. La consommation de glucose peut par exemple être suivie par le test du gène du glucose. Pour une mesure indirecte de la consommation de glucose, il est également possible de détecter le produit de dégradation du glucose, le lactate, à l'aide du dosage du lactate. Les performances de ces deux tests sont démontrées dans la publication : le dosage du glucose et le dosage du lactate permettent de surveiller avec précision le métabolisme cellulaire du glucose dans un essai à base de cellulaires. Dans l'AppNote intitulée : « ROS detection in a cell-based format using the Promega ROS-Glo™ assay », l'utilisation d'un test basé sur la luminescence pour détecter les espèces réactives de l'oxygène produites en excès est démontrée.
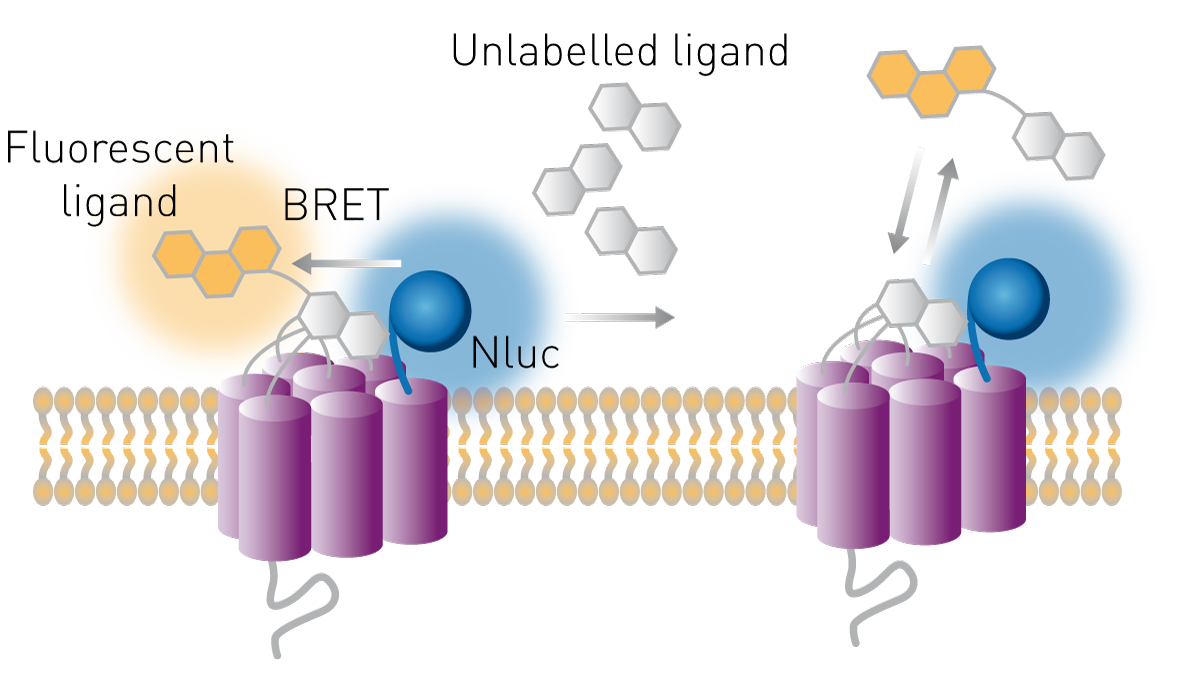
Les récepteurs sont des cibles courantes pour les médicaments et leurs ligands peuvent constituer des traitements potentiels. La liaison des ligands à leurs récepteurs peut être étudiée dans des essais cellulaires utilisant le principe BRET. La luciférase est exprimée dans la partie extracellulaire du récepteur et un ligand est marqué avec un fluorophore accepteur approprié. Si le ligand se lie à son récepteur, le donneur et l'accepteur sont suffisamment proches pour transférer l'énergie, ce qui augmente le rapport BRET. Cette méthode permet également d'étudier la liaison de composés non marqués au récepteur. Ces composés peuvent entrer en compétition avec un ligand connu pour la liaison au récepteur, marqué par un fluorophore. Si le rapport BRET diminue dans une telle configuration compétitive, c'est qu'un composé non marqué a déplacé la molécule acceptrice, ce qui entraîne une perte de transfert (voir la figure 9).
La manière dont ces tests permettent d'étudier la pharmacologie des récepteurs est expliquée dans notre exposé intitulé : « Real-time profiling of receptor pharmacology (profilage en temps réel de la pharmacologie des récepteurs) ».

Lecteur de microplaques HTS puissant et ultra-sensible
Lecteur de microplaques le plus flexible pour le développement de tests
Lecteur de microplaques flexible avec flux de travail simplifiés
Série de lecteurs de microplaques monomodes et multimodes évolutifs