Introduction
A variety of assays have exhibited utility for detection during high volume drug screens. However, at the culmination of these screens, the positive hits need to be validated in living cells that are relevant to disease, such as primary cultures of neurons, cardiomyocytes, or iPSC derived cell lines. Many of the assays used in HTS are inadequate in this realm as they are often end point lytic assays and/or require the exogenous application of substrate, and cannot be targeted to a distinct population of cells. To meet the need for methods capable of detecting signal transduction cascades in the living cell, Montana Molecular has developed robust genetically encoded biosensors. As a proof of principle, we demonstrate robust detection of Gs and Gi signaling in HEK293 cells using the CLARIOstar microplate reader.
Assay principle
Montana Molecular’s sensors are packaged in a modified baculovirus optimized for expression in mammalian cells (BacMam). Shown below (Fig. 1) is a schematic of the mechanism of our cAMP assay that utilizes cAMP dependent conformational changes in the EPAC cAMP binding domain to elicit changes in fluorescence of a fluorescent protein. The sensors come in either a red or green version and can be spectrally resolved in the living cell.
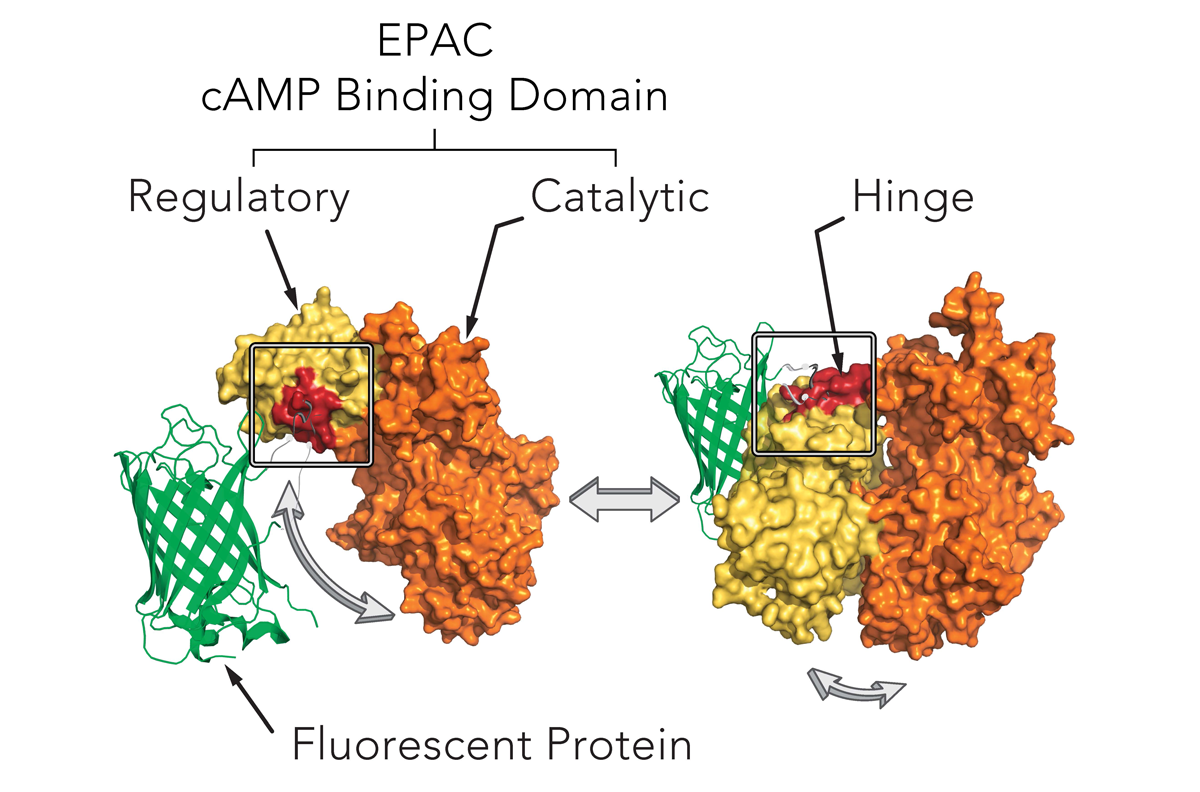
Genetically-encoded biosensors can either increase or decrease in fluorescence. Upward cADDis increases when cAMP production increases. Downward cADDis decreases when cAMP production increases, making it easy to separate background fluorescence from the fluorescent assay. For this study, we show results from both the Upward cADDis and Downward cADDis biosensors in Figure 3.
Gs and Gi Detection using cADDis1 cAMP sensor
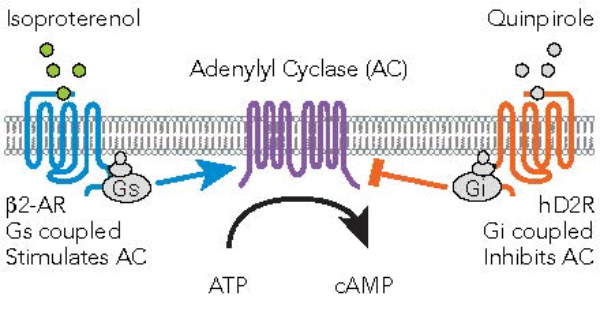
The schematic below (Fig 2) illustrates ß2-AR coupled Gs increases in adenylyl cyclase (AC) activity and the D2 receptor coupled Gi decreases in AC activity. We have validated assays that detect each of these signaling events on the CLARIOstar® microplate reader.
Materials & Methods
- HEK293 cells
- Montana Molecular cADDis sensors
- Greiner 96-well F bottom plates
- CLARIOstar microplate reader from BMG LABTECH
Sensor Transduction
HEK293 cells were transduced in suspension with BacMam carrying the indicated sensors and plated in 96-well plates. Cells were allowed to express sensor for 24-28 hours. Media was exchanged with PBS and the cells were allowed to rest at room temperature 30 minutes prior to experiment.
Instrument Settings
| Detection Mode: | FI (Bottom) |
| Detection Method: | Plate Mode, Kinetic |
| Scan mode: | Orbital Averaging |
| Scan diameter (mm): | 4 |
| Gain / Focal height: | Adjusted prior to test |
Optical Settings
| Excitation: | F 482-16 |
| Dichroic: | LP 504 |
| Emission: | F 530-40 |
Results & Discussion
Isoproterenol stimulated Gs detection using cADDis cAMP sensors
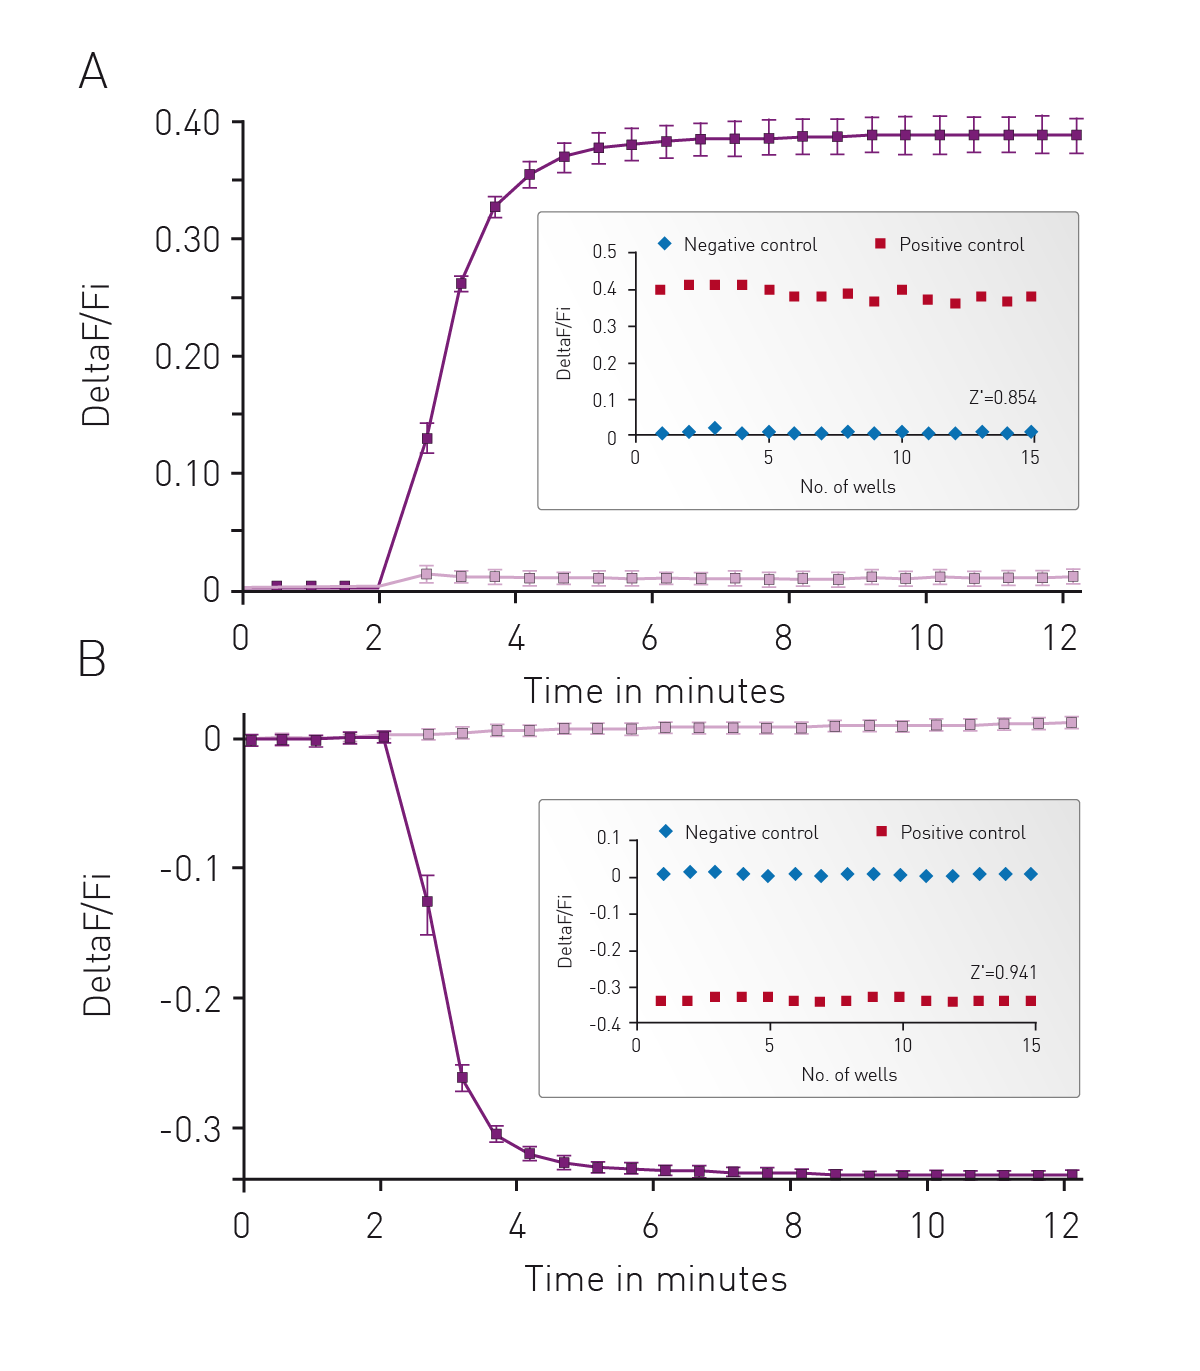
The well characterized response of HEK293 cells to Isoproterenol was used as the background to initially assess cADDis detection using the CLARIOstar. In Fig. 3 cells were monitored for 2 minutes to assess a baseline fluorescence then treated with 30 μM Isoproterenol or PBS and monitoring continued for an additional 10 minutes. Using either an upward or down green-cADDis sensor assay performance is robust based on the Z’ factor of greater than 0.85. The downward sensor exhibits slightly better performance (Z’ = 0.941) in part due to the fact that the signal from the sensor is opposite of any background fluorescence.
Forskolin-Free Gi Detection using cADDis Sensors
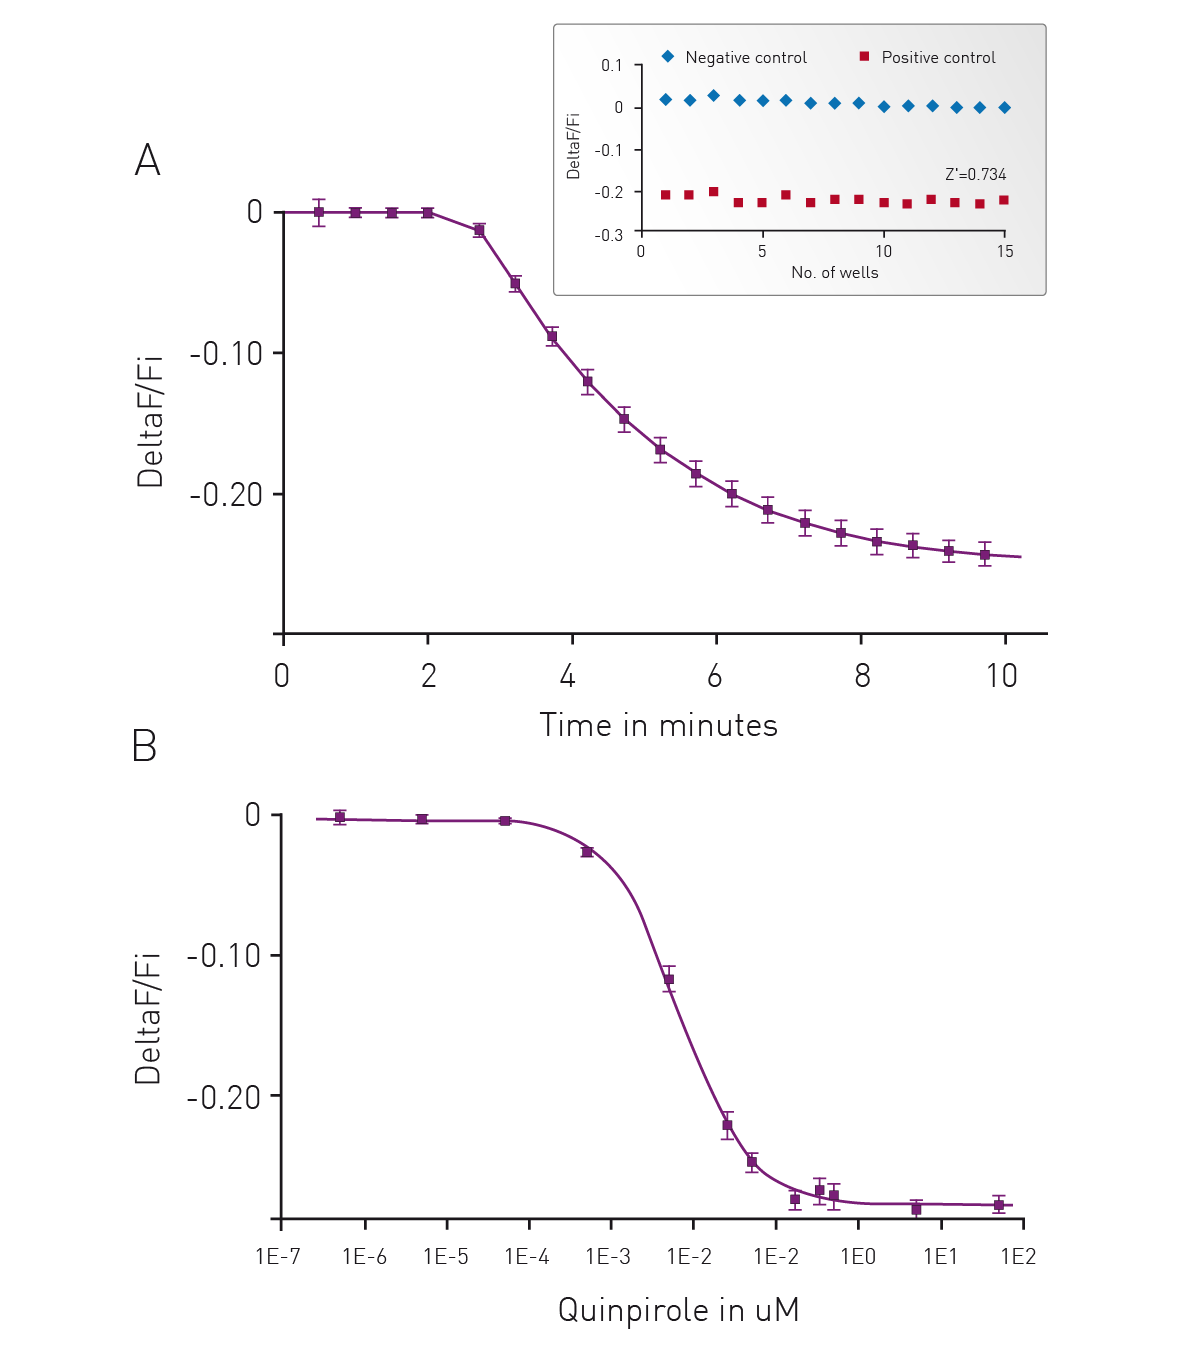
We have adapted our cADDis sensors for detection of Gi signaling in a forskolin free assay. Forskolin dramatically amplifies the effect of Gs at adenyl cyclases and has direct effects on ion channels.2 Use of forskolin in the cADDis assays is not necessary or recommended as it disrupts biological activity. If a GPCR with basal Gs activity is present, the response will be exaggerated by forskolin, and the apparent EC50 of agonists at the Gs-coupled receptor will be shifted, making agonists appear more potent than they are. In the case of Gi-coupled receptors, forskolin’s effect on Gs stimulation makes it more difficult to inhibit adenyl cyclase.3 Basal levels of cAMP are raised using co-expression of a constitutively active Gs mutant. This allows for real time, kinetic measurements of Gi signaling in living cells.
Conclusion
Montana Molecular’s genetically encoded assays are highly compatible with the CLARIOstar microplate reader. We obtained kinetic and dose response data for Gi and Gs signaling. Robust Z’ values were obtained for cADDis sensors.
References
- Tewson, P.H. et al. (2015) J. Biomol. Screen. 21(3): 298-305.
- Hoshi, T. et al. (1988) Science 40(4859): 1652-1655.
- Dessauer, C.W. et al. (1998) J. Biol. Chem. 273(40): 25831-25839.