PHERAstar FSX
Powerful and most sensitive HTS plate reader

Fluorescence polarization (FP) is a fluorescence-based detection method that is widely used to monitor molecular interactions in solution. Unlike fluorescence intensity which focuses on the quantification of emission intensity at a specific wavelength and neglects its polarization, fluorescence polarization specifically analyses as output the emission intensity of different polarization planes.
FP is typically used to assess biomolecular interactions such as protein-protein and protein DNA binding, as well as enzyme activity. It has been adopted in basic research as well as high-throughput screening.
Initially, fluorescence polarization had been mainly used in the diagnostic field. A FP immunoassay was first described in the 1960s. In life science research, applications were at first limited due to the lack of sensitive instruments. Currently, FP is experiencing strong popularity in biological research. This is mainly due to the increased performance and sensitivity of modern microplate readers that can deliver robust results with minimal variability and larger assay windows.
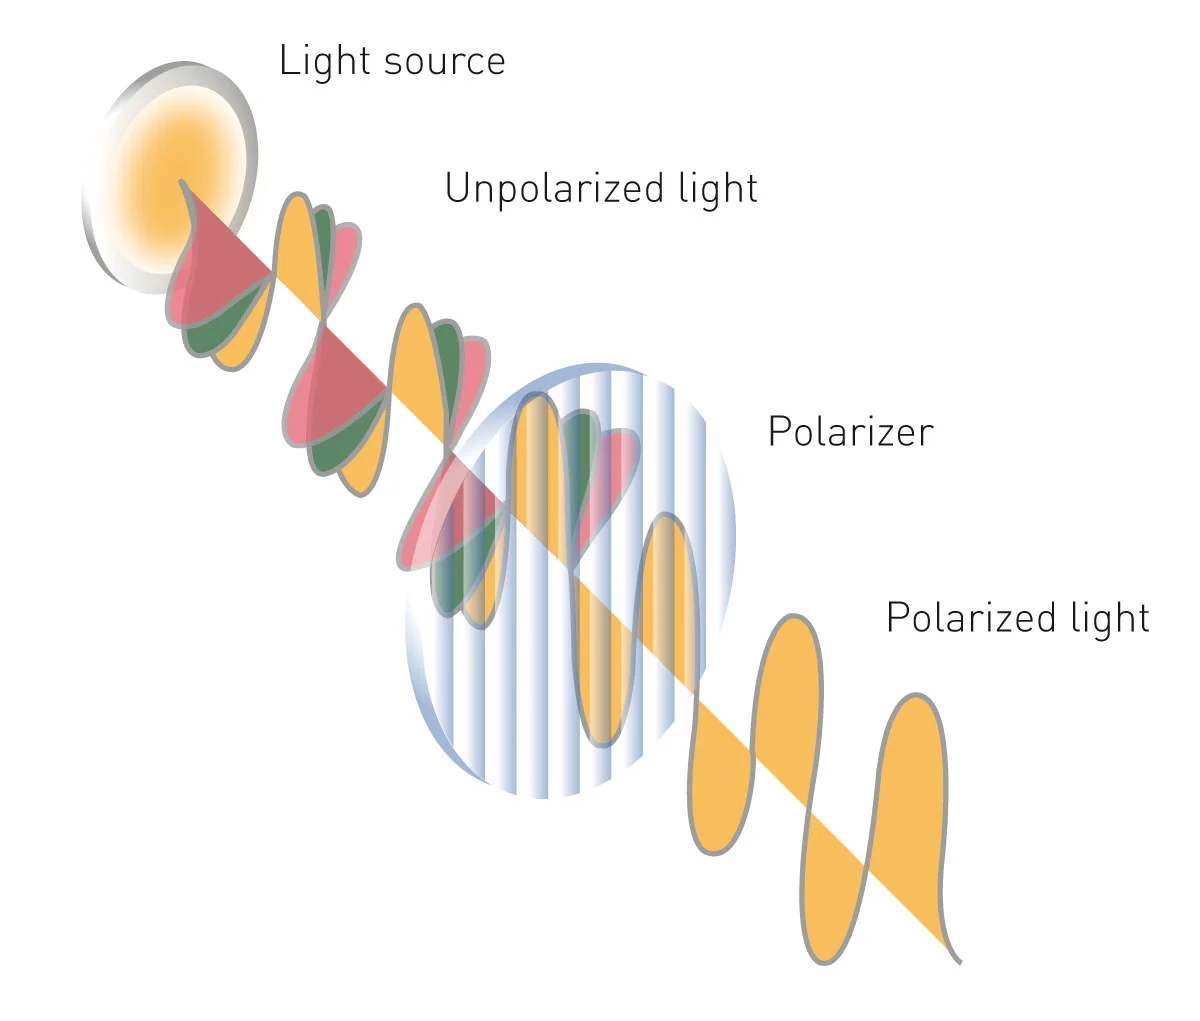
Light is an electromagnetic wave whose electric field oscillates perpendicularly to the direction of propagation. Non-polarized (unpolarized) light is defined as light where the direction of the oscillation of its electric field randomly fluctuates in time. Common light sources such as sunlight, and classic incandescent and halogen bulbs produce unpolarized light.
If the direction of the electric field is restricted to one plane by a specific filter, all selected light waves will oscillate in a single direction, producing plane or polarized light. The most common source of polarized light is lasers. Unpolarized light can be seen as a collection of light waves that are polarized on different planes with no predominant state of polarization (fig.1).
Depending on the orientation of its electric field, polarized light is classified into linear, circular, and elliptical. Linear polarization, whose electric field is limited to a single plane along the propagation direction, is prevalently used in life science applications and focus of this article. For light reflection and transmission, the two most relevant linear polarization states are parallel and perpendicular (relative to the plane of incidence).
Fluorescence polarization detection is based on the general theory of steady-state fluorescence detection that you can find on the fluorescence intensity page. In addition, its detection relies on the fact that the degree of polarization of a fluorophore is inversely related to its tumbling rate and on the observation that light emitted by a fluorophore can have different intensities on different polarization planes, typically perpendicular and parallel to the excitation plane.
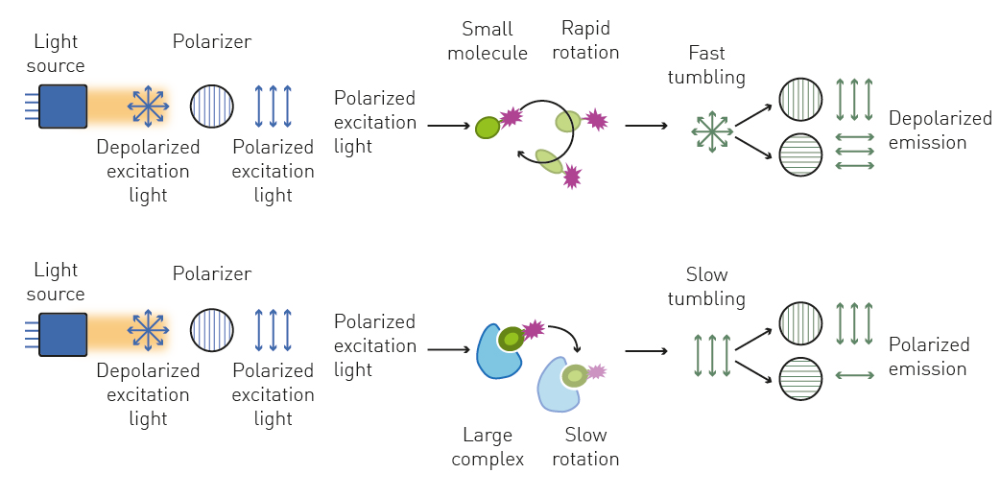
When plane-polarized light excites a small (typically <1.5 kDa) and unbound fluorescent molecule (the tracer), this mainly emits unpolarized light. This is caused by the fact that a small, free molecule rotates rapidly in solution during the time between excitation and emission, and accordingly emits light on different polarization planes (unpolarized).
Conversely, if the small fluorescent molecule is bound by a larger one (typically >10 kDa), its increased molecular volume slows down its rotation and results in the emission of light prevalently polarized in the same plane as the excitation source (fig. 2).
Fluorescence polarization is hence the measure of the amount of molecular rotation that takes place in the time between excitation and emission of the tracer. It is calculated by the following equation:
P = (F|| - F⊥)/(F|| + F⊥)
Quantitatively, it is defined as the difference between the emission fluorescence intensity parallel (F||) and perpendicular (F⊥) to the excitation light plane, divided by the total fluorescence emission intensity. 1
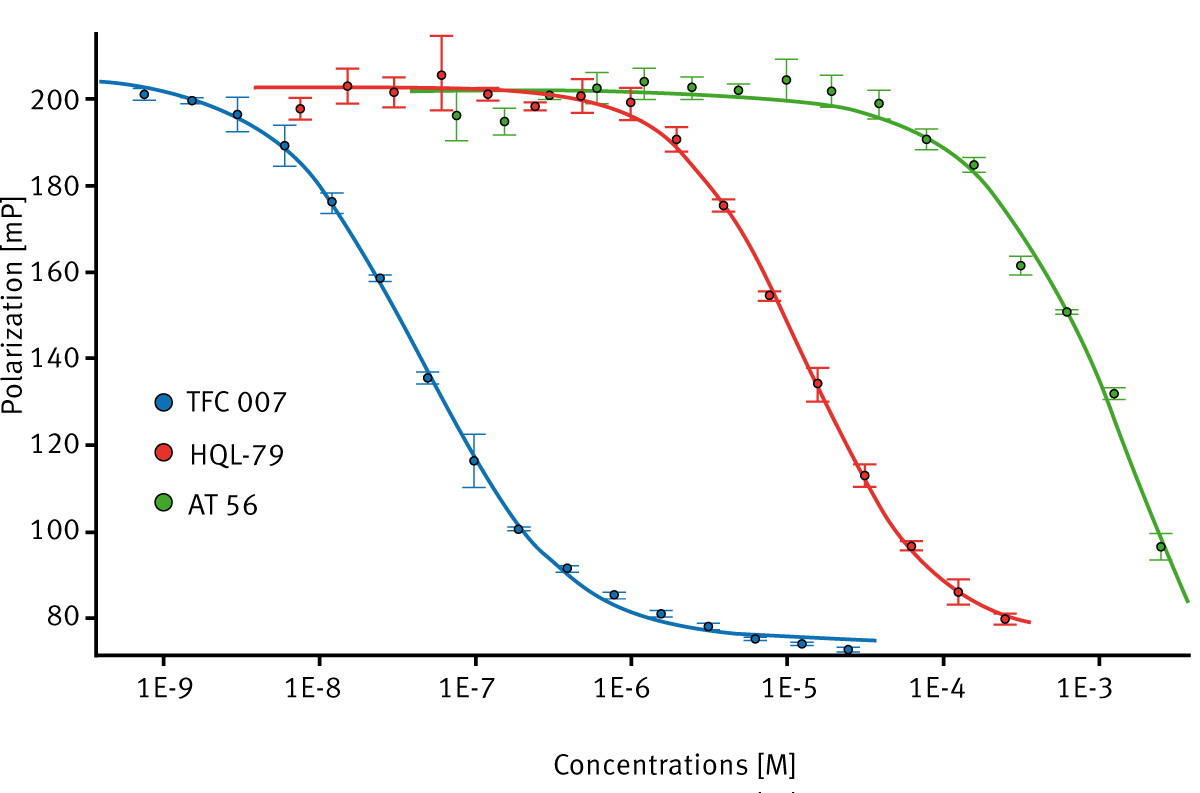
The value P is a number without dimension, as it is a ratio of light intensities. It is often expressed in millipolarization (mP), where 1 P = 1000 mP. Although P has values ranging from –330 to 500 mP, these are rarely achieved theoretical limits. In bioanalytic applications, typical data range from 10 to 300 mP (e.g., fig. 3).
The term anisotropy was introduced in 1960 and is frequently used in the context of polarized emission. Anisotropy (designated as either A or r) is the ratio of the emission intensities in the equation below:
r = (F|| - F⊥)/(F|| + 2 F⊥)
F|| indicates the intensity after vertically polarized excitation and vertical polarization on the emission light. F⊥ indicates the intensity when using a vertical polarizer on the excitation and a horizontal polarizer on the emission. 2
Fluorescence polarization and anisotropy are mathematically related and used interchangeably. Both are derived from the emission intensities of polarized and unpolarized light and represent an average of the bound/unbound states of a fluorescent molecule. For most applications, the information content of their functions is identical, as anisotropy does not provide any additional information. 3
Typically, the choice of one term or the other is dependent on practical considerations and habit. Fluorescence polarization is most often used to describe the entire technology and in clinical chemistry, whereas anisotropy is more common in biophysics and biochemistry.
Fluorescence polarization can be detected on a microplate reader and relies on the same procedure and setup as fluorescence intensity. There are, however, a few differences mainly related to the selection of the polarization planes.
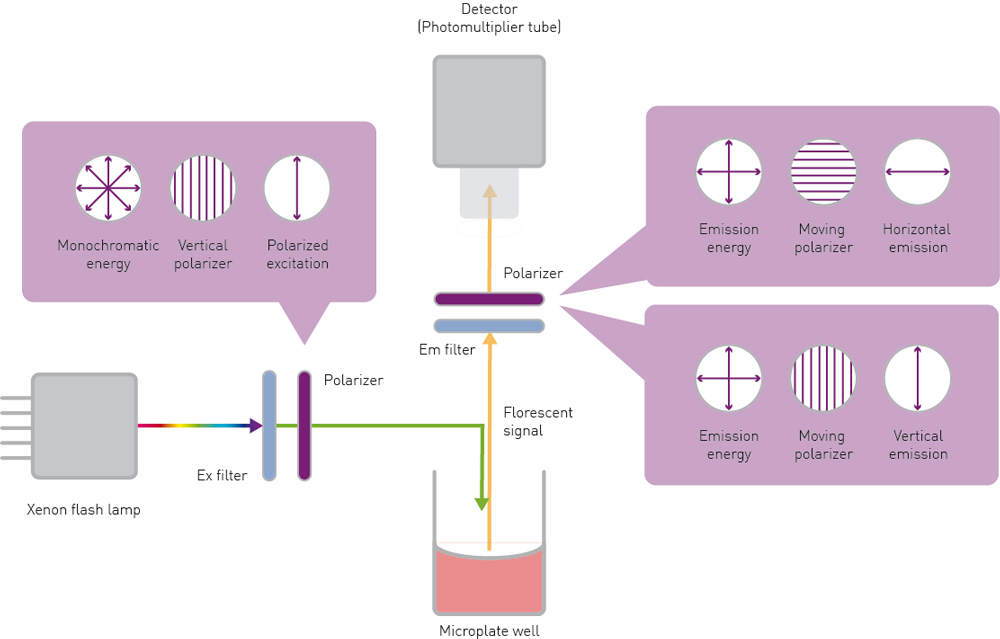
The sample is excited at a specific wavelength by vertical (parallel) polarized light. The excitation light source is typically a xenon or halogen lamp. Its white light is spectrally filtered using either a filter or a monochromator. The polarization plane is selected by a specific filter called a polarizer.
The electric field vector of natural light can assume any direction of oscillation relative to the direction of propagation. Polarizers are optic elements, commonly thin films, that can isolate one direction of the electric vector. The excitation polarizer is positioned between the excitation source and the sample. The relative orientation of the vertical plane transmits parallel light to the sample and blocks perpendicular polarized light.
The light emitted by a sample is spectrally filtered either by a filter or monochromator to remove unwanted wavelengths. In addition, the emitted light has to be separated into parallel or perpendicular waves depending on its orientation to the plane of the polarized excitation light. This is made possible by emission polarizers positioned in the light path between sample and detector, which are typical of the same type as the excitation polarizer. Finally, the intensity of both polarized planes is quantified by a detector, typically a photomultiplier tube (PMT).
The two planes are detected separately. The simplest approach is to detect the parallel and perpendicular planes with two sequential measurements. After the parallel polarization intensity is detected in the first measurement, the emission polarizer rotated by 90° is used to detect the horizontal (perpendicular) plane (fig. 4).
High-end fluorescence polarization plate readers like the PHERAstar FSX can acquire the two polarization planes simultaneously, thanks to the Simultaneous Dual Emission detection technology. This approach saves time and reduces the variability generated by two sequential measurements.
Generally, monochromators are not recommended for FP detection because of their intrinsic low transmission of light and high background (stray light). These factors concur in increasing sample variability, negatively affecting assay window and robustness.
For detection in the UV range, readers have to be equipped with a xenon lamp. Halogen lamps are not recommended because of their poor emission below 400 nm. Moreover, specific UV polarizers are required, as regular ones have a poor transmission in the UV wavelengths.
Low levels of polarization (P) indicate that the fluorescent molecules did not bind and move freely in solution. High P levels indicate the presence of a larger molecular complex. Although the measurement range in bioanalytic applications from 10 to 300 mP may seem quite restricted, very precise measurements with standard deviations of ± 0.5 mP can be achieved with high-end multi-mode microplate readers such as the PHERAstar FSX or CLARIOstar Plus.
The choice of a fluorescent dye in FP assays is of key importance. Their excitation and emission spectra must differ from the wavelengths of other molecules present in the solution to reduce autofluorescence and they need to have a large Stokes shift to reduce the negative influence of light scattering. Fluorophores must be easily conjugated to the tracer but neither perturb its tumbling nor interfere with the interaction. In addition, they have to have a high quantum yield (i.e., high intensity), and be chemically stable and photostable.4
The most commonly used fluorophores are fluorescein isothiocyanate (FITC) and dyes with similar spectra. Recently, however, fostered by the improvement in the performance of modern microplate readers, red dyes such as Cy3B and Cy5 have gained in popularity. As their intrinsic low photon yield no longer represents a limitation due to technical improvements in signal detection, their use can be advantageous to reduce autofluorescence-derived false negatives that commonly emit in the green and blue range, and false positives caused by light scattering events. 5
Among the approaches used to study molecular binding events, FP is unique. Since it is based on a single fluorescent label strategy additional separation steps are not required. Accordingly, fewer and usually less expensive reagents can be used in comparison to conventional methods. Additionally, as sample integrity is not affected, samples can often be measured repetitively, provided pH, temperature, and viscosity are constant.
FP enables direct monitoring of the free/bound ratio of a tracer in solution in real-time, allowing equilibrium analysis with very low concentrations (typically down to the picomolar range). However, because of its real-time nature, experiments are not limited to equilibrium, and association/dissociation kinetics can be easily analyzed.
FP is a homogeneous technique with a simple mix-and-read protocol that does not require the separation of bound and free species to be measured. Homogeneous assays provide more accurate quantification of binding events, as the binding reaction is not disturbed by additional steps. However, it is important to note that other homogeneous assays, such as FRET, TR-FRET, or AlphaScreen® require further labeling reactions in addition to the single labeling of the tracer.
Furthermore, the ratiometric nature of FP eliminates the negative influence compound absorbance or quenching may have on data acquisition and enables miniaturization. All these reasons have led to the adoption of FP assays in high-throughput screening.
Despite all its advantages, there are some limitations to this measurement system. FP requires large changes in molecular volume for the generation of maximum signal and assay window. At best, a fluorescence polarization binding assay can monitor the interaction between a small and a large molecule and requires labeling of the smallest interaction partner with a fluorophore. Accordingly, tracers are usually small proteins or peptides, cytokines, and chemical compounds. This usually assures the largest possible difference in molecular volume upon binding and hence the largest possible assay window. The FP binding assay is not suited for the observation of the interaction of two large proteins.
In addition, compound autofluorescence and light scattering may cause artifacts. Hence, it is usually recommended to quantify the fluorescence background of a well prior to the addition of the fluorescent dye and subtract it from the calculation. As autofluorescence is typically less pronounced at higher wavelengths, the adoption of red dyes such as BODIPY TMR or Cy5 dyes can be used to minimize background noise. 6, 7
The FP binding assay can be employed to analyze molecular interaction or dissociation events in receptor-ligand interactions (also receptor-ligand kinetics), protein-ligand or peptide-protein interactions, protein-DNA interactions, as well as prefibrillar protein aggregation. In addition, it can also be used to identify interfering compounds and non-specific inhibitors.
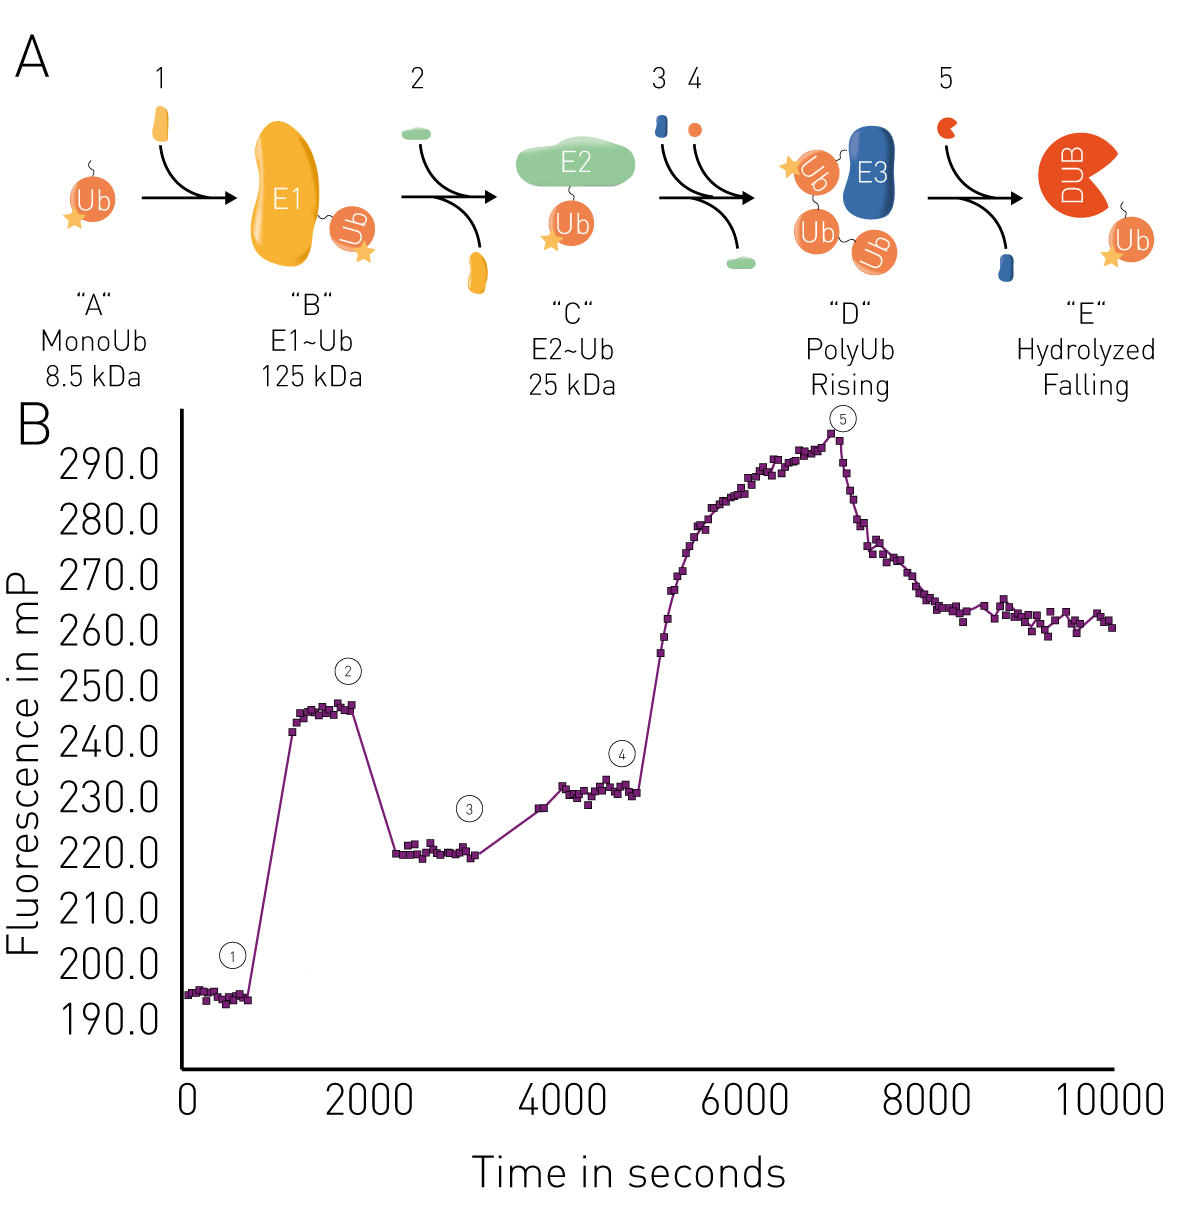
Other applications include the analysis of membrane fluidity in liposomes and mitochondrial membranes, and enzymatic assays such as proteolysis, RNA synthesis, binding kinetics, and ubiquitin conjugation/deconjugation in real-time (fig. 5). Applications in real-time for ubiquitin can be used for example in targeted protein degradation for PROteolysis TArgeting Chimeras (PROTACs) or molecular glues, including studies of their binding activity to their targets and the kinetics of interactions. FP binding assays can also be used to look at targeted protein degradation arising from specific interactions between known degrons and ligases.
In the 90s, FP was adopted in the drug screening environment to facilitate the drug discovery process. Nowadays, it is routinely used in screening facilities, due to its homogeneous, fast, and quantitative format. Since FP is often linearly proportional to the percent of bound/free tracer, it is frequently employed to determine IC50 values of drug candidates.
In drug discovery, it has been used to study different targets such as GPCRs, kinases, phosphatases, and proteases. While, in interaction studies, FP usually detects an increase in molecular volume, in dissociation and enzymatic degradation assays the decrease in molecular volume is typically used as a readout.
The main applications of fluorescence polarization assays in HTS are the analysis of direct molecular interactions as well as enzymatic reactions. Here, fast and sensitive microplate readers enable the efficient screening of small molecules for an increasing range of target classes. Examples include screening for inhibitors of the ubiquitination regulator and anticancer target CSN5, as well as screening of H-Prostaglandin D Synthase inhibitors.
Förster´s Resonance Energy Transfer (FRET) is a common method to study interaction events. Typically, the two putative interaction partners are labelled with two different fluorophores (donor and acceptor). FRET, however, can also take place between like fluorophores (homoFRET). FP can be applied to homoFRET, as the energy transfer causes randomization in the emission polarization, producing a depolarized signal. HomoFRET-FP can be used to study protein accumulation or dimerization events in a cell as described in the application note “Monitoring of insulin granule packaging in live cells using homoFRET-FP detection” (fig. 6).

Fluorescence polarization immunoassay (FPIA) has been the first applied in biochemistry. It is a competitive biochemical assay used to detect antigens or antibodies. In a fluorescence polarization immunoassay, an antigen bound to a fluorophore is used as a tracer. This and a second antigen typically compete to bind a selected antibody. High tracer-antibody binding typically results in a polarized signal, whereas if the unlabelled antigen is prevalently bound by the antibody, the free tracer will generate unpolarized light. This change is proportional to the amount of antigen present in the sample.8
Powerful and most sensitive HTS plate reader
Most flexible Plate Reader for Assay Development
Flexible microplate reader with simplified workflows