White? Black? Or clear? Besides the number of wells and well volumes, the choice of colour is one of the most important decisions you make when selecting a microplate. The wrong colour can even make it (next to) impossible to measure a particular assay. In this HowTo Note, we will give an overview of the performance of different plate types for the three most used detection modes on microplate readers: absorbance, fluorescence intensity and luminescence. In addition to pointing out the effects of plate colour on measurements, we also give recommendation for each detection mode, which should simplify decisions when planning your experiments.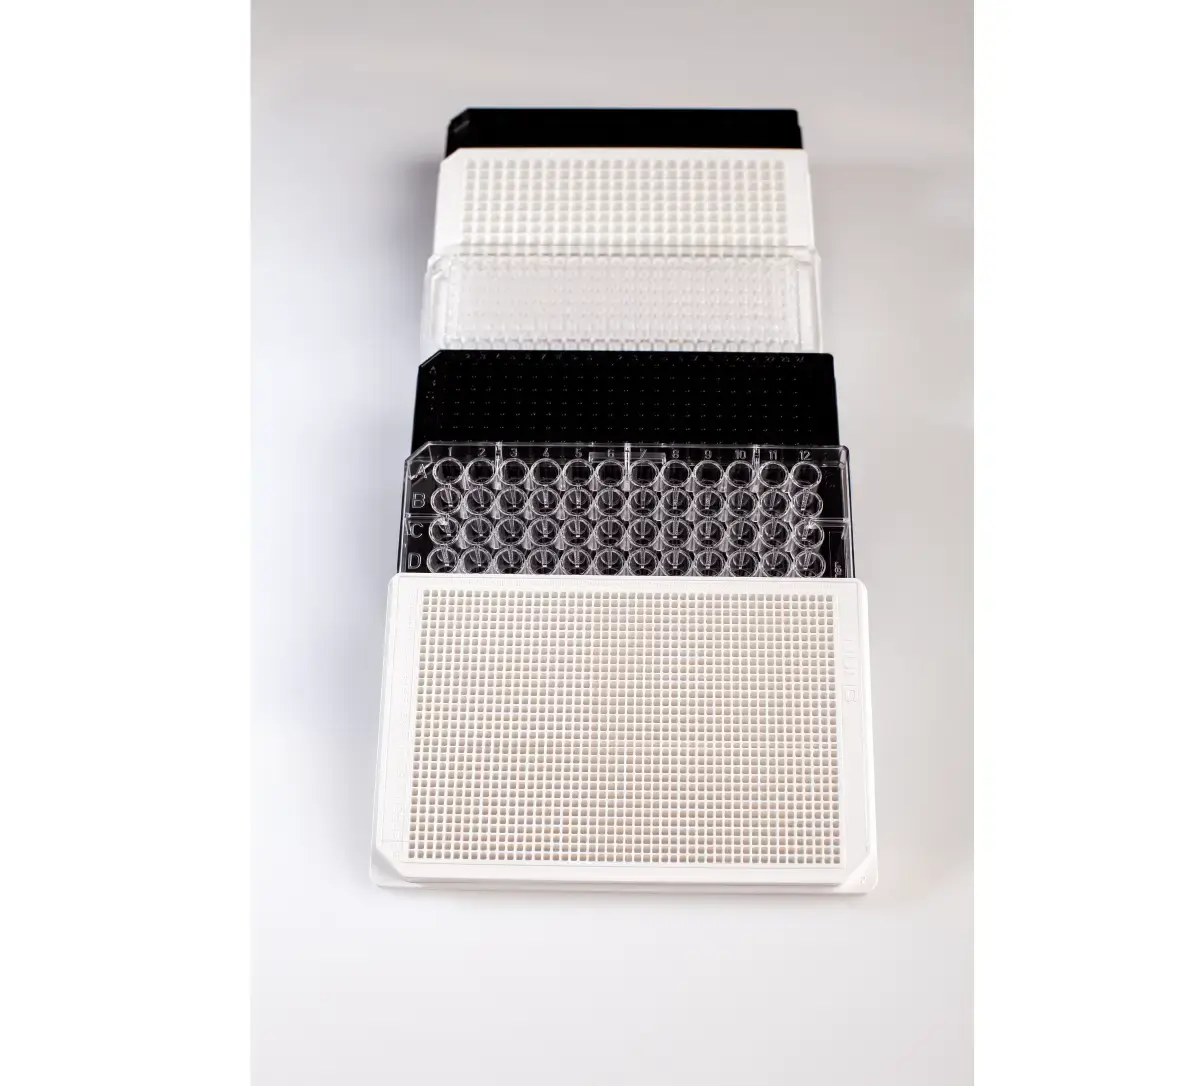
Did you know?
BMG LABTECH microplate readers can be equipped with a spectrometer. This spectrometer enables full absorbance spectra from 220-1000 nm to be detected in less than 1 sec.
Absorbance measurements
For absorbance measurements in microplates, photons are transmitted through a liquid sample and detected. The higher the optical density of the sample, the more photons are absorbed and the lower the proportion of transmitted and measured light. Absorbance is often considered the simplest detection method. However, this is very deceptive, as many parameters can create pitfalls when measuring absorbance. Especially the shape of the upper liquid level of a sample, the so-called meniscus, plays a decisive role in absorbance measurements. It changes the pathlength at different positions in the well and thereby affects measurement results. Here, one should pay particular attention to the plate properties and the coating, as these can have a significant influence. Tissue culture plates lead to a much more pronounced meniscus.
When absorbance is measured, light is directed through the sample. Therefore the material of the microplate must be transparent. But not all transparency is the same. Absorbance is typically measured in clear polystyrene (PS) plates. These plates show very high transmission and consequently only limited background absorbance in the wavelength range above 320 nm. But their absorbance increases significantly below 300 nm. Consequently, measurements in the UV-range are typically masked by the background absorbance of the plate itself. This is also the case for DNA measurements (figure 2). While a classical DNA spectrum with peak at 260 nm is obtained in a UV-transparent plate (dark green line), regular PS plates result in high absorbance values from 220-280 nm, which completely masks the DNA measurements (dark blue line). The curve obtained for these DNA measurements is like the curve for an empty PS plate (light blue line), which also shows high absorbance below 280 nm. In contrast, the UV-transparent plate alone (light green line) shows only negligible absorbance in this wavelength range.
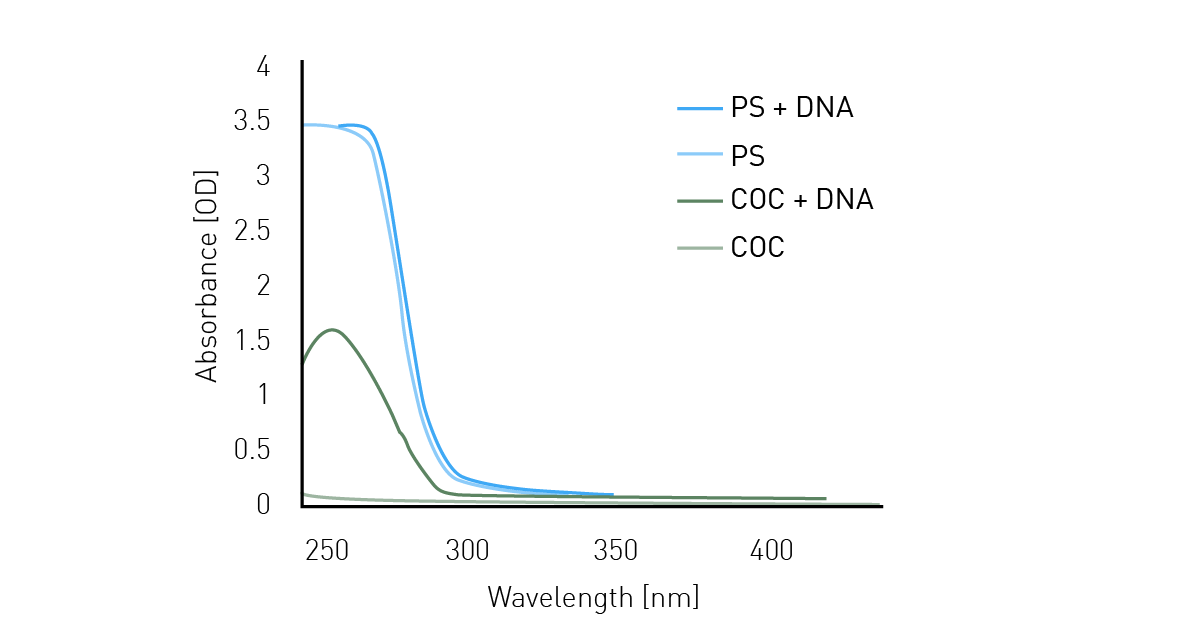 DNA (150 μg/mL, 50 μL) was added to a clear 384-well polystyrene plate and a UV-transparent plate made of cycloolefin (COC). An absorbance spectrum from 240-450 nm was scanned with a resolution of 1 nm. In addition to the wells containing DNA, empty wells were measured to detect the plates contribution to the optical density (OD) values.
Absorbance measures the fraction of light that is absorbed by a sample in a well. Since absorbance is related to transmission of a light beam through a sample well, the colour of the walls of the well will not significantly influence the measurements. If there are other measurements planned in the same plate that depend on the colour of the well walls, the use of white or black plates with clear bottoms is possible without any restrictions.
Did you know?
Some companies offer black or white foils that can be attached underneath black or white clear bottom microplates. This gives the user full flexibility to perform absorbance or bottom optic measurements without compromising the quality of the fluorescence or luminescence data.
Fluorescence intensity measurements
Fluorescence is a physical process in which light is first absorbed by a molecule and emitted afterwards. The fluorescence intensity measurement must therefore usually be preceded by an excitation event. Since part of the energy is lost and converted into movement and heat, emitted light exhibits lower energy and therefore longer wavelengths compared to the corresponding excitation light. Due to the input of external energy, fluorescence measurements usually show a strong signal yield. However, there are many other things besides the target fluorophore that are excited by the excitation event and then produce an emission signal, such as cellular components, media components, substrate and last but not least the plate itself! Therefore, a reduction of background signal due to autofluorescent components is highly desired when measuring fluorescence intensity.
Dynamic range refers to the extent of signal intensities, that a reader is capable of measuring. A high dynamic range allows different values to be distinguished from each other and from the background with more confidence. Dynamic range depends on the relative intensity values and also on the background signal, that is present independent of the sample concentration. Autofluorescence will lead to an increased background and will reduce the dynamic range. The slope of the standard curve and the signal to blank ratio (S/B) are good indicators of the dynamic range of an assay, as a high dynamic range results from low background and otherwise high signal intensities of the standards.
Figure 3A shows the standard curves for a fluorophore at different concentrations in different microplates. When using the optimal gain for each individual plate, Black plates showed the lowest relative fluorescence units (RFUs) at low fluorophore concentrations compared to all other plates. White plates resulted in the highest signal at low fluorophore concentrations compared to other colours. Clear plates and black plates with clear bottoms show RFUs slightly exceeding those of opaque black plates. However, the signals are still much lower compared to those obtained from white plates. Black microplates partially absorb light and will therefore quench emitted signal. They contribute only slightly to background signals due to autofluorescence. In this experiment, the standard curve for the black plates yielded the highest slope, while white plates led to the lowest slope. This difference in dynamic range is also reflected in the evaluation of the signal-to-blank (S/B) ratios (figure 3B). Black plates showed by far the highest S/B.
A standard curve with different fluorophore concentrations ranging from 0-20 nM was measured in 96-well plates of different colours. Gain was adjusted for each plate colour individually.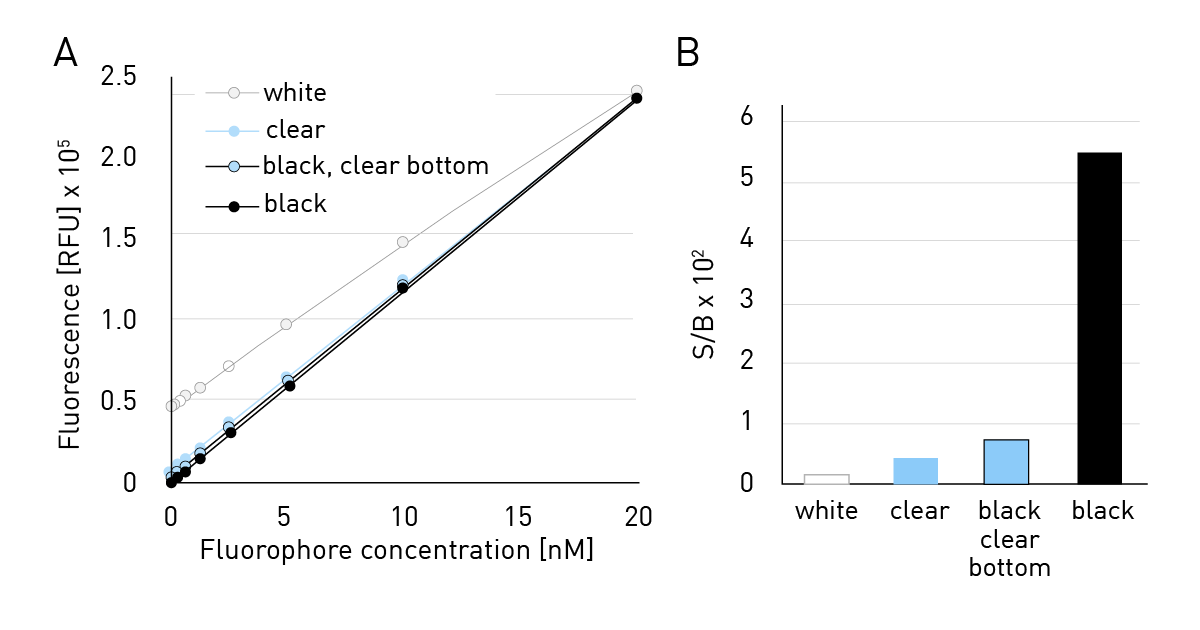
Did you know?
As an alternative to black and white plates, some suppliers also offer grey plates, and even black plates with white inner coating of wells. They are intended to provide maximum signal amplification and simultaneous cross-talk reduction in luminescence or BRET assays.
Luminescence measurements
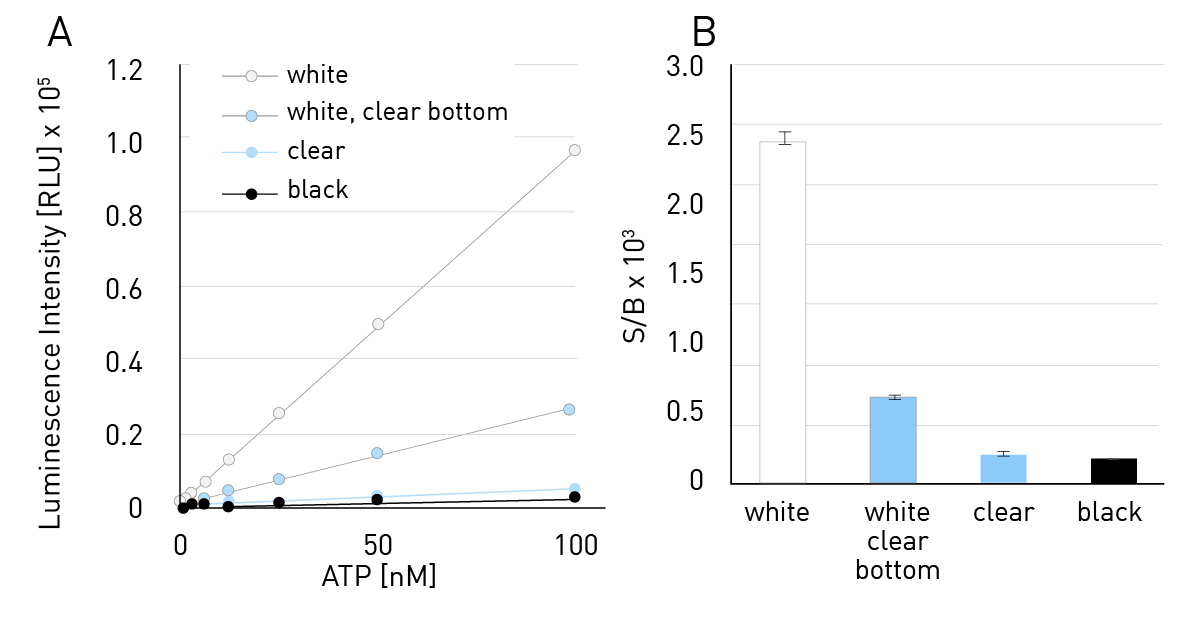
Luminescence is the emission light through energy conversion. This is achieved by the conversion of a substrate to an electronically excited state. Consequently, the electrons of the excited product or intermediate return to a lower energy state by emitting photons and generating luminescence. In contrast to fluorescence, there is no excitation event needed in luminescence. In other words, if a photon originates from a well in a luminescence test, something you want to measure has emitted it. Therefore, background signals, that affect the quality of an assay are not really an issue in luminescence measurements. However, even the signals from very concentrated samples are not remarkably high in luminescence assays. Therefore, the assays benefit from white plates, which are able to reflect the light that is generated by chemiluminescent reactions and amplify it, thereby increasing the lower detectable
limit.
Figure 4 shows the luminescent measurement of an ATP standard curve measured with a luminescence assay in 384-well plates. All assays were measured with a gain of 3600. All plates show low background counts in this case. Due to low intrinsic background, using a white plate leads to the highest slope here, followed by the white plate with clear bottom, the clear plate and the black plate. The same behaviour was observed in the S/B ratios. White plates show the highest S/B ratio, followed by white plates with clear bottom and clear plates. Black plates only allow for low S/B ratios.
A standard curve with different ATP concentrations ranging from 0-200 nM was measured using a luminescence assay in 384-well plates of different colours. A gain of 3600 was used for all measurements. Very bright luminescence assays are an exception. If the intrinsic signal of the assay is large enough, a measurement in black plates is also possible, since here the benefit from background reduction overcomes the benefit of signal amplification.
Conclusion
- For absorbance assays you will need wells with clear bottoms
- For absorbance-based measurements below 320 nm, you must use UV-transparent plates (e.g., cycloolefin microplates)
- Black plates are recommended for fluorescence measurements. They significantly reduce commonly encountered autofluorescence and high
background signals - For luminescence assays, white plates are recommended to amplify the signal since luminescence assays typically generate weak signals and have
low background. Grey plates additionally reduce cross-talk. For particularly bright luminescence assays, a black plate is also recommended.
- Initial recommendation
- Detailed Recommendation