Introduction
PARP1 (poly-[ADP-ribose] polymerase 1) acts in the early stages of DNA damage response. It recognizes and binds single or double strand DNA breaks, subsequently becoming active to utilize NAD+ to add PAR (poly-[ADP-ribose]) chains onto itself, DNA and nuclear proteins like histones. A function of autoPARylation is the release of PARP1 from DNA. The cancer therapies that target PARP1 inhibit NAD+ association and thus maintain the PARP1 DNA interaction promoting cytotoxicity1.
Recently a PARP1 co-factor HPF1 (histone PARylation factor1) was discovered that changes the substrate specificity of PARP1 leading to preferential histone PARylation1. This newly discovered interaction has spurred the re-evaluation of existing PARP inhibitors (PARPi), that were previously characterized for their association with PARP1 alone. Here we describe an assay that can address either PARP1 or PARP1-HPF1 complex associations with PARPi using a kinetic fluorescence polarization read-out and reagent injections performed by the CLARIOstar Plus2.
Assay principle
The kinetic fluorescence polarization assay employed here (Figure 1) exploits the fact that all current PARPi share the same binding site as NAD+.
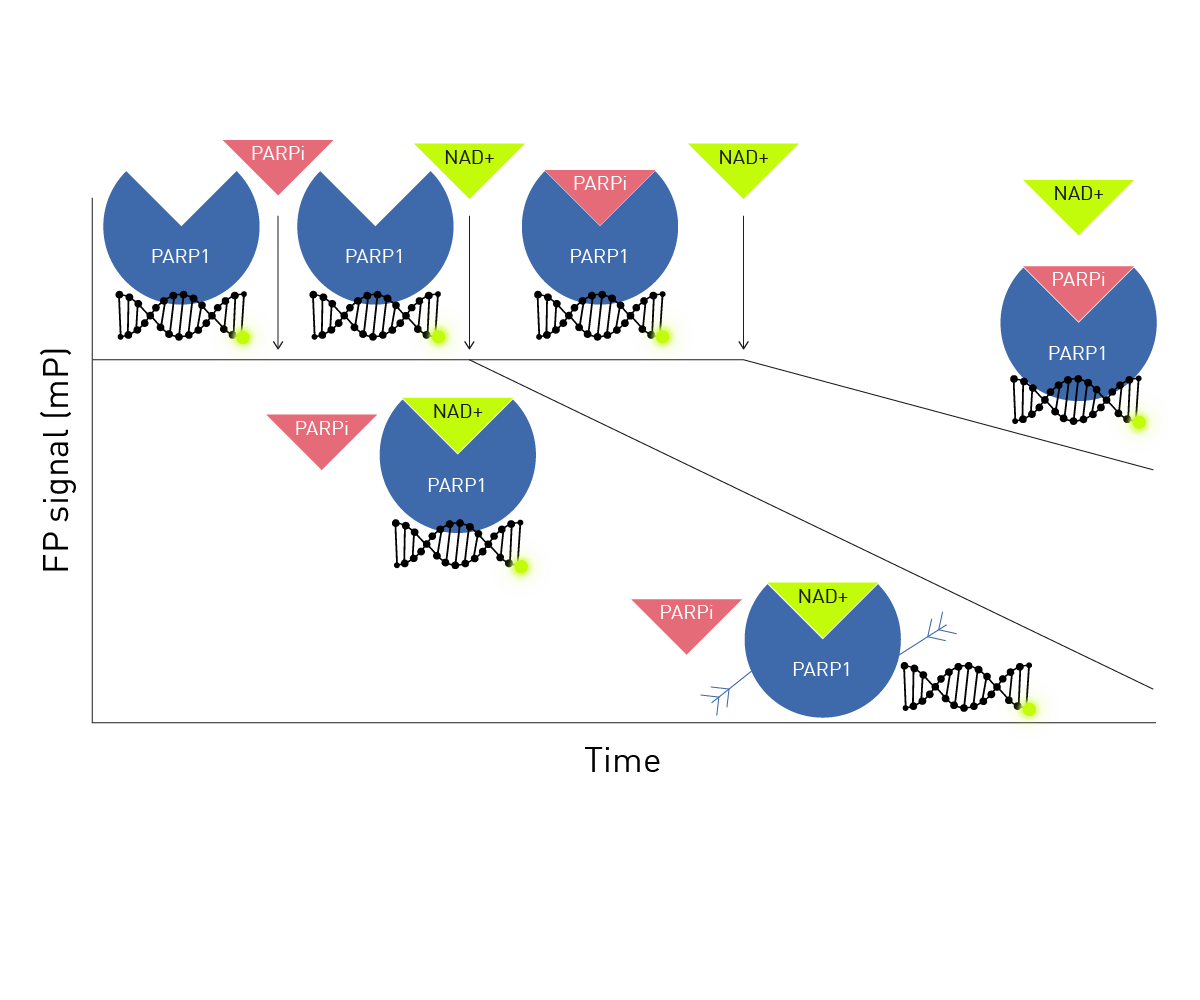 A fluorescein labeled double stranded 18-mer* serves as the tracer. When the 18-mer* is associated with PARP1 (or PARP1-HPF1 complex) FP signal is high. PARPi is added for different times before the addition of NAD+. NAD+ induces autoPARylation of PARP1 and dissociation of the 18-mer* observed as a decrease in FP. If the incubation time for the PARPi is sufficient for it to associate with PARP1 or PARP1-HPF1 complex, then the FP signal will remain high for longer due to NAD+ access to the binding site being blocked by PARPi.
Materials & methods
- Black, 384-well, plates (#3575, Corning)
- p18-mer*(5’-phosphate-fluorescein-GGGTTGCGGCCGCTTG GG-3’) (double-stranded; IDT)
- Olaparib (#S1060, Selleck)
- CLARIOstar Plus (BMG LABTECH)
- Other chemicals and reagents were obtained from commercial sources2
Experimental Procedure
PARP1 and HPF1 were prepared as previously described3. 50 mM Tris-HCl (pH 8.0), 50 mM NaCl, 1 mM MgCl2 0.1 mM EDTA; 0.01% IGEPAL was used as binding buffer. PARP1 (20 nM), p18-mer* (10 nM) and HPF1 (900 nM), when used, were incubated in binding buffer for 15 min. Olaparib (20 nM) and NAD+ (6 mM) were dissolved in binding buffer and used to prime reagent injector 1 and 2, respectively. PARP1 complexes from above were transferred to a microplate (10 µl/well).
Instrument Settings
|
Fluorescence Polarization, well mode
|
||
|
Optic settings
|
Filters |
Ex: 482-16 Em: 530-40 |
|
Gain |
1540 |
|
|
Focal height |
5.9 |
|
|
General settings |
Flashes |
40 |
|
Kinetic window 1 settings |
Number of intervals |
15 |
|
Interval time |
1 s |
|
|
Injection |
Volume |
10 µl |
|
Pause after injection |
1.5 – 150 seconds |
|
|
Injection 2 |
Volume |
10 µl |
|
Kinetic window 2 settings
|
Number of intervals |
80 |
|
Interval time |
1 s |
|
Results & Discussion
As an example of the data collected, the association of the PARPi Olaparib is presented. Figure 2 shows the representative traces of FP signal over time comparing the effect of different delay times before NAD+ addition on the rate of FP decrease associated with the association of Olaparib with PARP1.
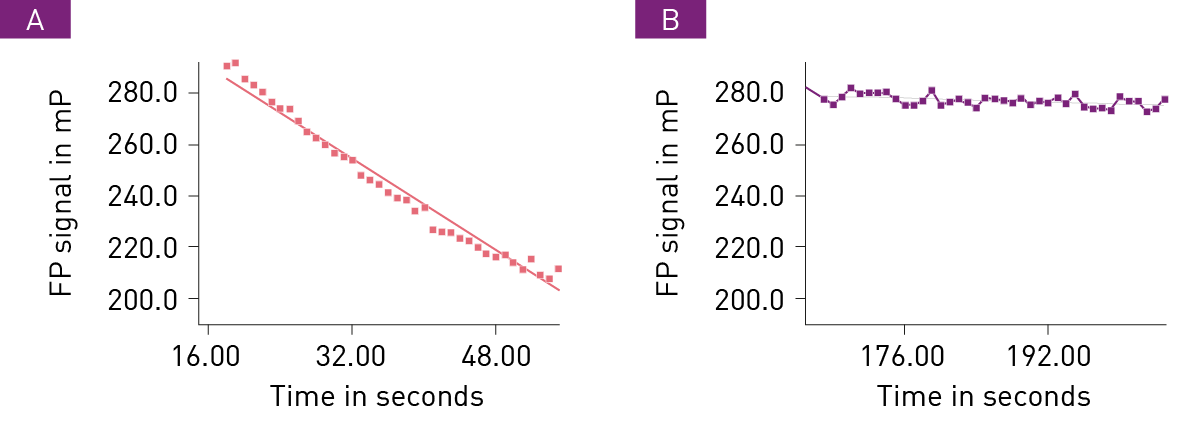
Following treatment with Olaparib, NAD+ was added at after a delay of 1.5 seconds (A) or 150 seconds (B), respectively. An average of 2 progress curves are displayed along with a linear fit line. The slope of the linear indicates the rate of p18mer* release.
As expected, longer delay times before NAD+ addition exhib-it slower decrease in FP signal due to association of Olaparib with PARP1. As a consequence, less free PARP1 is available to utilize NAD+ and subsequently release p18mer*. Additional experiments were conducted with different delay times to obtain additional rate values.
Figure 3 shows a plot of the various rate values versus the delay time before NAD+ addition.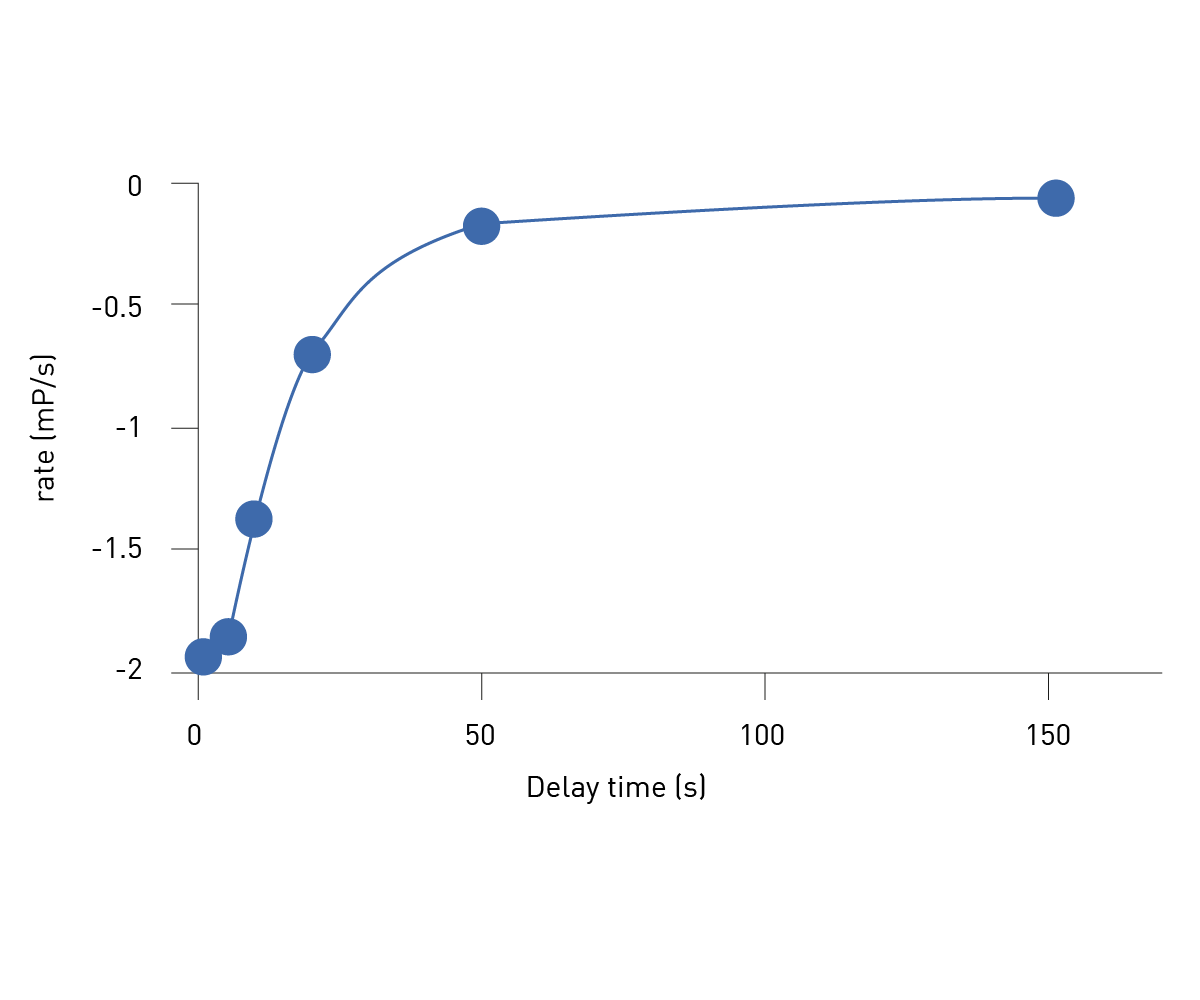
Results presented elsewhere2 show the linear replot in Figure 3 can be used to discover the apparent rate of association (kobs) for Olaparib. Similar experiments were conducted at different Olap-arib concentrations and kobs plotted vs. Olaparib concentration. These results revealed a linear dependence of kobs on Olapar-ib concentration for PARP1. The same tests were performed using the PARP1-HPF1 complex which also revealed a linear relationship between Olaparib concentration and kobs. This linear relationship is indicative of a simple one-step association mechanism. Furthermore, from this plot the true association rate (kon) for Olaparib can be determined.
In addition, other PARPi were tested with the same association tests. Importantly these results showed that the same simple one-step association mechanism is employed for all tested PARPi when associating with either PARP1 or PARP1-HPF1 complex.
Figure 4 shows the comparison of the different inhibitors and their association (kon) with PARP1 or PARP1-HPF1 complex.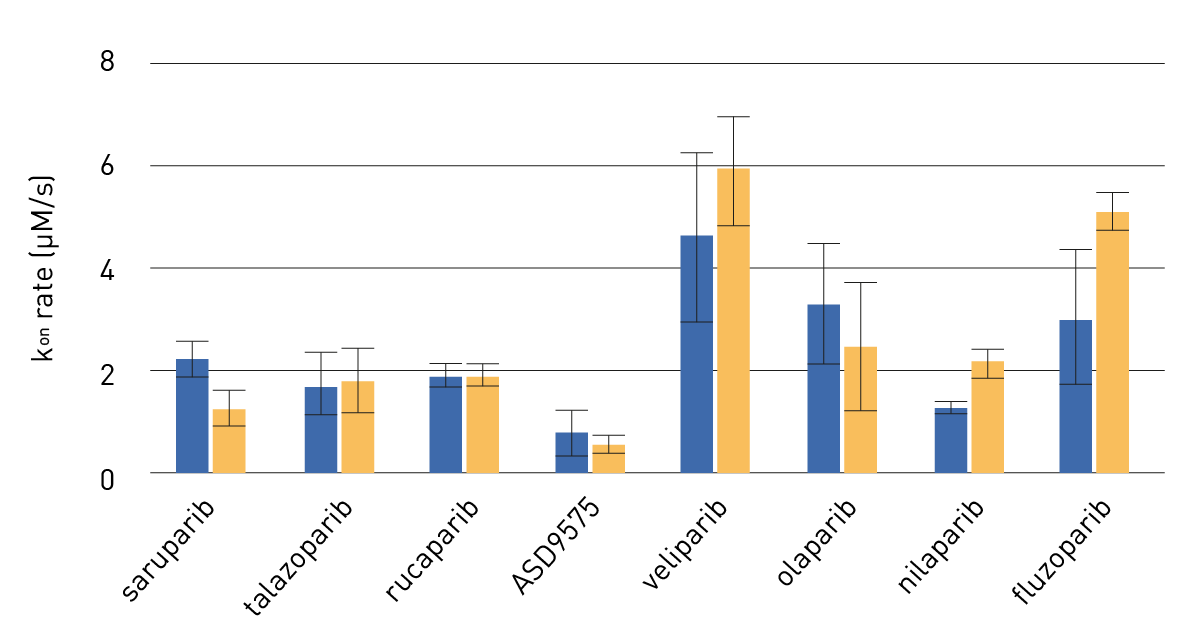
Average kon (+/-SD) for indicated PARPi with PARP1 (blue bars, left side) or PARP1-HPF1 (orange bars, right side) [n=3-4]. Differences after HPF1 addition are seen for fluzoparib, niraparib and saruparib.
Conclusion
The kinetic FP assay employed here will be a useful tool in fully characterizing the mechanism of action of PARPi. This understanding should help to further improve inhibitor performance and possibly reveal novel therapies that improve cancer treatments.
References
- Suskiewicz, M.J., et al. Progress and outlook in studying the substrate specificities of PARPs and related enzymes. FEBS J. (2021) 288: 2131-2142
- Stojanovic, P et al. Slow Dissociation for the PARP1-HPF1 Complex Drives Inhibitor Potency. Biochemistry. (2023) 63: 2382-2390.
- Johannes, R et al. The BRCT domain of PARP1 binds intact DNA and mediates intrastrand transfer. Mol. Cell. (2021) 81: 4994-5006.