Introduction
An accurate and reliable method of assessing cellular viability is a vital requirement for any work related to cell culture. This includes drug toxicity studies in addition to basic monitoring of the longterm stability of a culture. Currently, there is a wide range of assays that can be used to assess cellular viability based on various different biochemical and molecular principles.
In general, there are two main ways in which a cell can be defined as non-viable. If the cell has: (1) a compromised plasma membrane or, (2) has lost its metabolic functioning. Dyes such as trypan blue and propidium iodide are non-permeable to the plasma membrane.
Therefore, only cells with a compromised plasma membrane will take up these types of dye. Another way of identifying a compromised plasma membrane is to detect substances in the extracellular medium which are normally only found within the cytosol of a cell. Therefore they must have leaked through the plasma membrane in order to reach the outside of the cell. An example of this type of method is the lactate dehydrogenase assay, which detects the cytosolic enzyme (lactate dehydrogenase) in the extracellular medium.
The work described in this application note is based on the propidium iodide (PI) assay. This is a very powerful assay, which allows viability to be measured dynamically over long periods of time. This is very useful when studying the effects of various substances, which may not necessarily have an instantly induced effect on the cell. Therefore this method enables the identification of any delayed death, which may be missed when only assessing viability at one specific timepoint. Furthermore, since the measurement is dynamic over a long period of time (24 hrs), the rate at which the death is occurring can be fully investigated. In this experiment, we describe a further development of a high throughput method for dynamically assessing neuronal death with the help of a BMG LABTECH microplate reader.
Materials & Methods
- Black 24-well plates (Iwaki, Scientific Laboratory Supplies LTD)
- Propidium iodide (PI, Sigma)
- BMG LABTECH microplate reader
Cerebellar granule cells were obtained from post-natal Wistar rats (P5-8) and cultured directly onto 24-well plates at a plating density of 280-300,000 cells per well. PI was diluted with dH2O to a concentration of 5 mg/mL and used at a final concentration of 50 μg/mL (diluted in experimental buffer referred to as ‘Ctrl’) (Protect the PI from light since it is photosensitive).
The BMG LABTECH microplate reader was set to fluorescent mode with an excitation wavelength of 544 nm and an emission wavelength of 612 nm. The culture medium from each well was removed and replaced with 500 μL of the PI-Ctrl solution. Four measurements were made at 60-second intervals in order to establish a resting level of PI fluorescence (pre-stimulation). This PI-Ctrl solution was removed and stored in a separate 24-well plate. The cultures were incubated for 60 minutes at 27°C in various concentrations of glutamate all diluted in an experimental buffer containing 50 μg/mL PI, 10 μM Glycine (Sigma, UK), and no Mg2+. Throughout this 60-minute incubation period, measurements were taken at 15-minute intervals. In order to obtain a background level for the PI solution, the PI-Ctrl solution was measured. The glutamate-PI solution was then removed and replaced with the PI-Ctrl solution. Measurements were taken at 30-minute intervals for 23 hours. At the end of the 24 hours, the PI-Ctrl solution was removed and either EtOH (100 %) or Triton X (0.02 %) was added to each well in order to induce maximal death. Then the PI-Ctrl solution was added back and 5 measurements of this level of maximal PI fluorescence were taken.
Results & Discussion
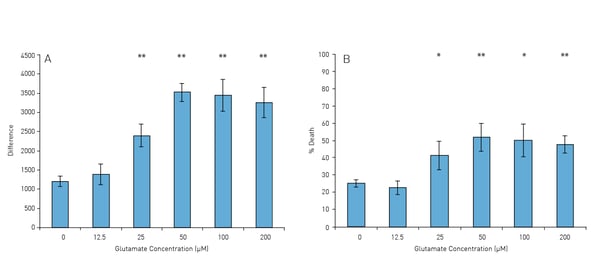
The signal curves in Fig. 1 represent the changes in PI fluorescence depending on the glutamate concentration (0-200 μM). With increasing concentration of glutamate the resulting PI signal is also significantly increased.
For quantifying the changes in the PI signal two methods can be used: (1) difference of each individual PI signal from its corresponding resting level (Figure 3 and 2) the percentage death normalised against the resting level (0%) and the maximal death (100 %) induced by EtOH (100 %) or Triton X (0.02 %) (Figure 4) referred to as the “Min-Max range”. Both methods show that the death induced by the glutamate is dose dependent. Furthermore, using the temporal dimensions of the measurements, one can estimate the time it takes for a significant amount of death to appear (initiated). In these experiments, the lag period between the end of the glutamate exposure and the initiation of significant levels of death is dependent on the glutamate concentration hence, cultures exposed to larger doses of glutamate have shorter lag periods.
Conclusion
We show that the PI assay is a very useful tool for monitoring neuronal viability. It allows a complete analysis of the dynamics of the response to a specific substance, which in our case is the neurotransmitter glutamate. Numerous parameters, including lag times and rates of death can be assessed using this PI method. This is advantageous compared to other methods used for assessing neuronal viability since most of these methods usually involve a single end-point measurement or require termination of the preparation.


