Introduction
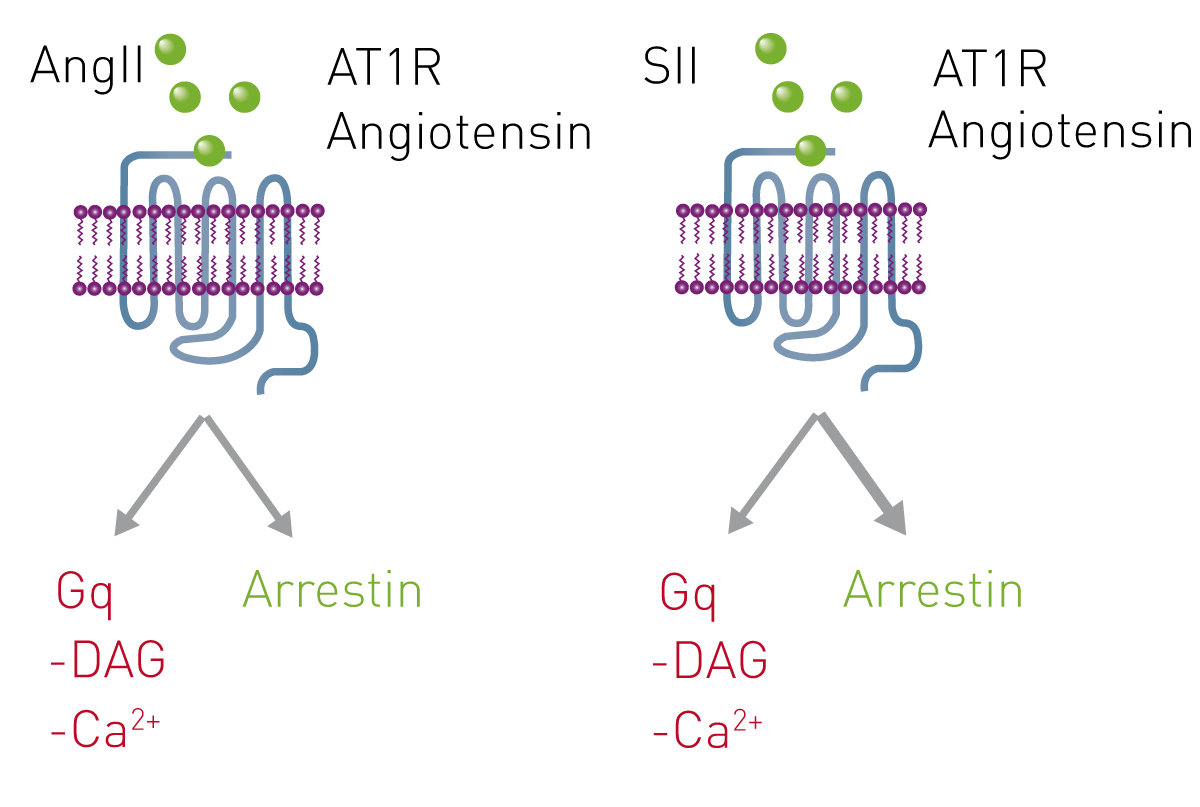
Activated G-protein coupled receptors (GPCRs) can signal through both G-protein and arrestin pathways. Some ligands bias the receptor toward signaling through one or the other pathways which can affect downstream cellular effects1. For example, arrestin-biased agonists at the Angiotensin II type 1 (AT1R) receptor reduce arterial pressure and increase cardiac performance while unbiased or G-protein biased ligands fail to improve cardiac performance2. The need for better tools to reliably identify and quantify agonist bias inspired us to develop methods that capture signals from β-arrestin and G-protein second messengers in real time. Signals from each pathway can be collected simultaneously and with high fidelity with a BMG LABTECH CLARIOstar plate reader.
Assay Principle
Temporal patterns of GPCR signaling processes can influence detection and quantification of biased agonism3 and these patterns vary with different receptors and agonists. However, this “kinetic context” is absent with standard endpoint measurements. To capture second messenger signaling responses over time, we developed red and green fluorescent biosensors4,5 for β-arrestin, cAMP, DAG, Ca2+ and PIP2. Each biosensor is constructed with a single fluorescent protein that changes in fluorescence intensity when signaling occurs. Red and green biosensors can be combined in a single assay to simultaneously measure response functions of both arrestin and G-protein mediated signals in the same population of cells. We combined a green biosensor for β-arrestin with a red DAG sensor, or R-GECO, a red biosensor for Ca2+, in live cells expressing the Angiotensin receptor AT1R. We activated the receptor with known ligands and monitored fluorescence intensity over time on the BMG LABTECH CLARIOstar microplate reader.
Materials & Methods
- HEK293T cells
- Montana Molecular green β-arrestin sensor, red DAG sensor, and R-GECO calcium sensor.
- Greiner CELLCOAT 96-well microplate, black, µClear bottom (Cat. No. 655946)1
- BMG LABTECH CLARIOstar microplate reader
- Angiotensin II and Trevena peptides TRV120026, TRV120045, and TRV120055 were obtained from GenScript. SII was obtained from MyBioSource.
Experimental Procedure
Sensor expression: HEK293T cells were transduced in suspension with BacMam vectors carrying the indicated sensors and plated in 96-well plates. After 24 hrs, cell culture media was exchanged for DPBS and cells were placed at room temperature for 30 minutes prior to drug addition.
Drug addition and dose response: For all experiments, baseline fluorescence measurements were acquired, after which the plate was removed and drug was added using an electronic multichannel pipette. Changes in fluorescence intensity were measured immediately after drug addition and over several minutes to capture response functions for each of five ATR1 ligands.
Instrument settings
|
Optic settings |
Fluorescence intensity with bottom optic |
||
| Monochromator settings | β-Arrestin sensor (Alexa 488 presets) |
Ex: 488-14 Dichroic: auto Em: 535-50 Gain: appr. 2500 |
|
| Red DAG or R-GECO Ca2+ sensor |
Ex: 566-18 Dichroic: auto Em: 620-40 Gain: appr. 2800 |
||
|
General settings |
Number of flashes: |
40 |
|
|
Setting time: |
0 s |
||
| Kinetic settings |
Number of cycles: |
42-205 |
|
|
Incubation |
25°C |
||
Results & Discussion
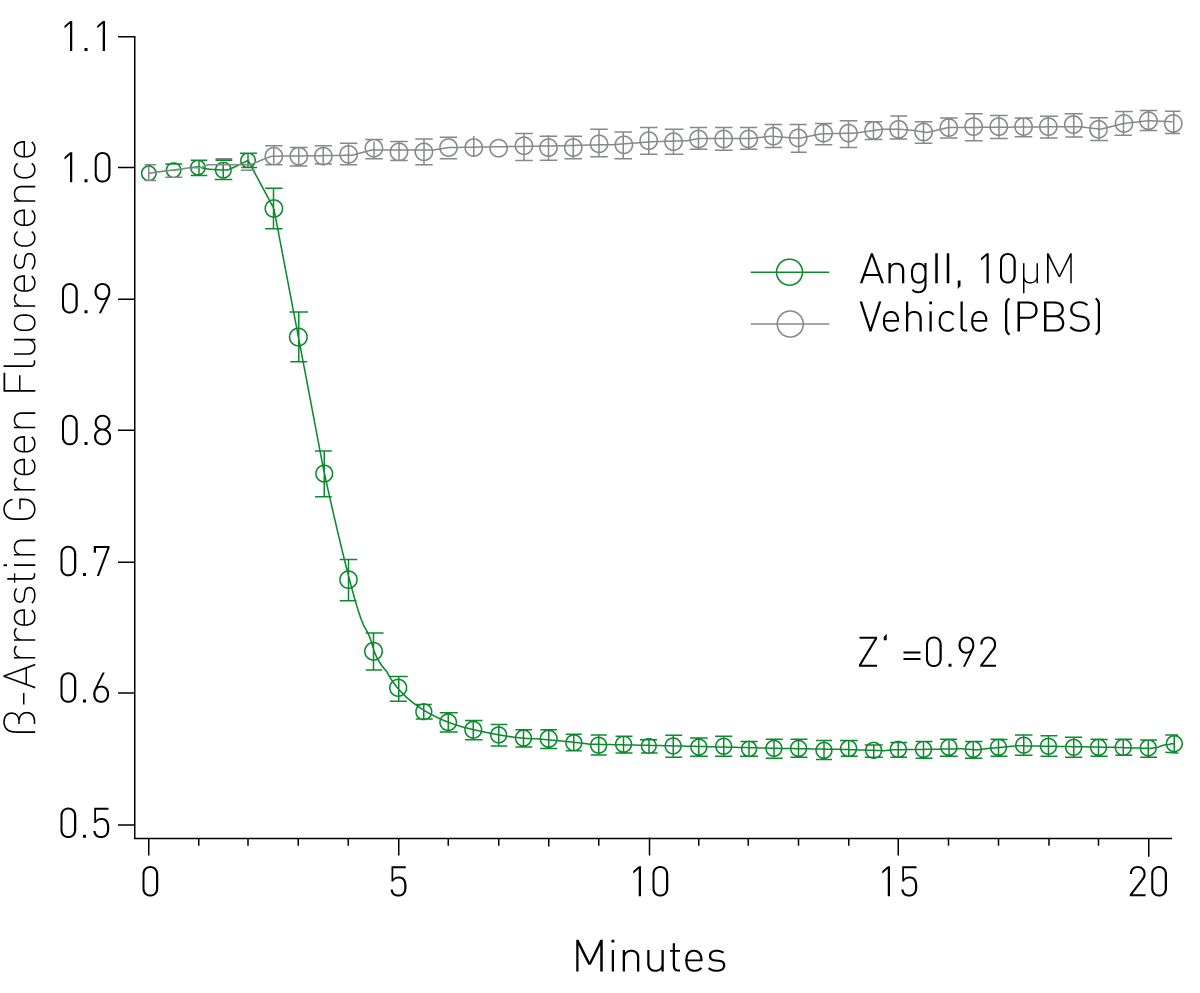
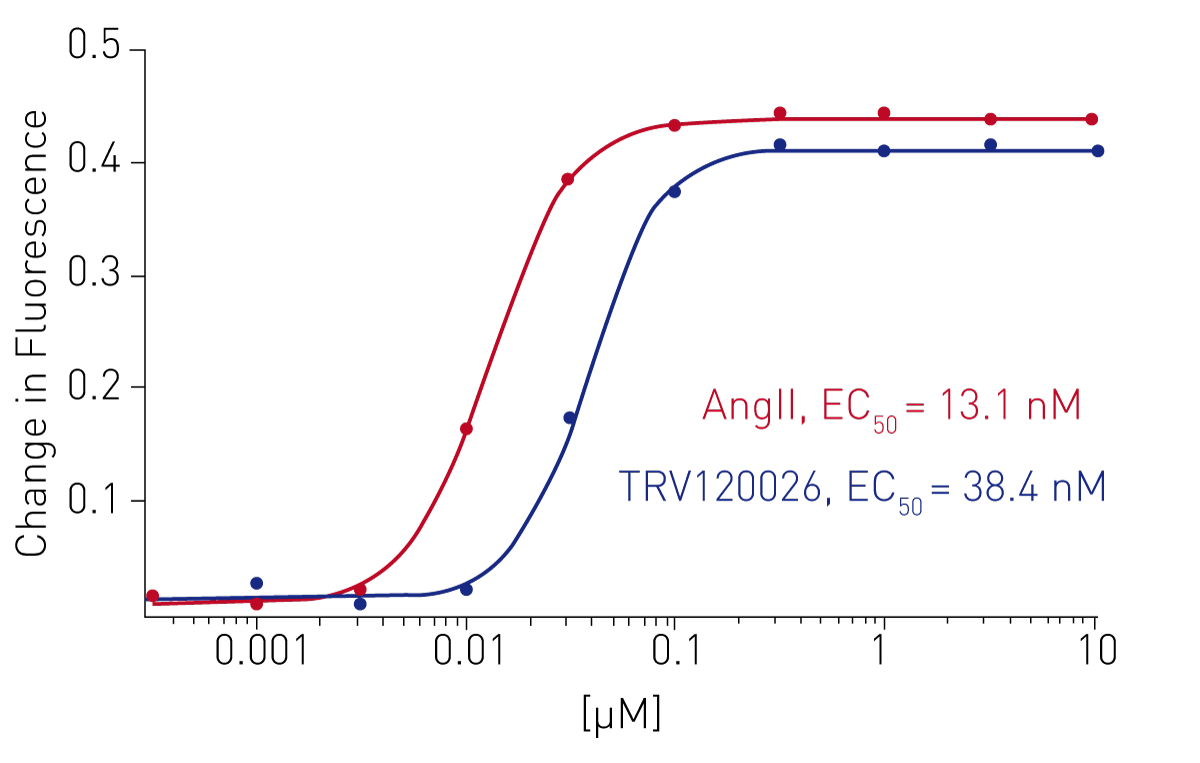
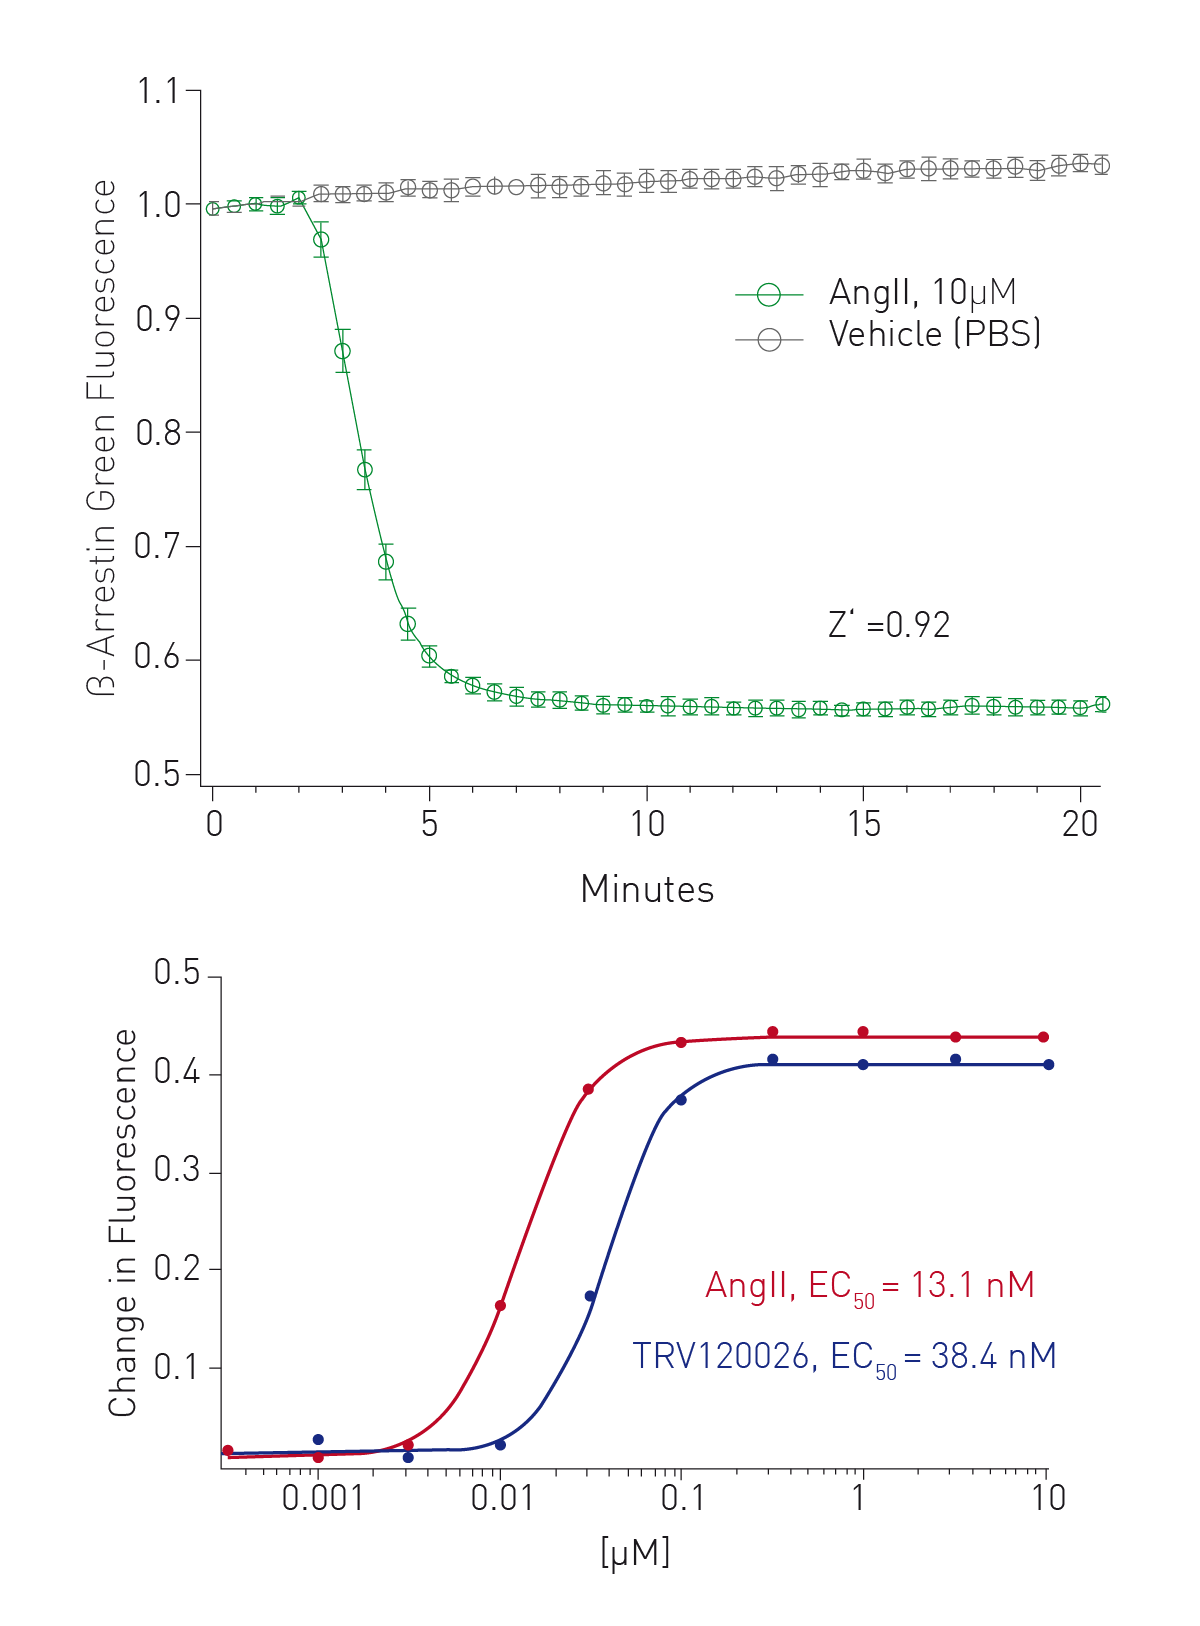
β-arrestin response was captured over several minutes on a BMG CLARIOstar and is indicated by a robust change in fluorescence intensity and a Z’ value of 0.92 (Fig. 2). Dose response measurements were made with two AT1R agonists, generating reliable EC50 values (Fig. 3).
Five AT1R receptor agonists (30µM) produce different β-arrestin, DAG, and Ca2+ response functions over time (Fig 4). Kinetic analysis of the response function from each ligand can be used to reliably assess agonist bias6.
Conclusion
Fluorescent biosensor assays for β-arrestin and G-protein signaling can be combined in living cells and monitored on a BMG LABTECH CLARIOstar with unprecedented precision. The optical path featuring Linear Variable Filter (LVF) monochromators provide both sensitivity and bandwith flexibility that are ideal for detecting genetically-encoded fluorescent biosensors.
References
- Smith, S et al. 2018. Nat. Rev. Drug Disc.17: 243-260.
- Violin, J et al. 2010. JPET 335 (3): 572-579.
-
Herenbrink, K.C. et al., 2016. 7, p.10842.
- Tewson, P. et al. 2012. PloS one, 7(8), p.e42791.
- Tewson, P. et al., 2018. SLAS discovery, 23(9), pp.898–906.
- Hoare, S.R.J. et al., 2019. doi.org/10.1101/772293.