Introduction
The Transcreener® technology was developed by BellBrook Labs to quantify the production of ADP during enzyme reactions. Different detection modes are possible in combination with the Transcreener® method (* FI, FP and TR-FRET). This application note focuses on the homogeneous, competitive red ADP2 fluorescent intensity (FI) assay. The assay is based on the detection of ADP, therefore is compatible with any enzyme class that produces ADP, including protein, lipid, and carbohydrate kinases, ATPases, DNA helicases, carboxylases and glutamine synthetases. The assay is a simple one step homogeneous detection assay that can be applied to a wide range of ATP concentrations (0.1 to 100 μM ATP). In this application note we will show that combination of the Transcreener® chemistry with the BMG LABTECH microplate readers provide excellent Z’values, indicating a robust assay and instrumentation.
Assay Principle
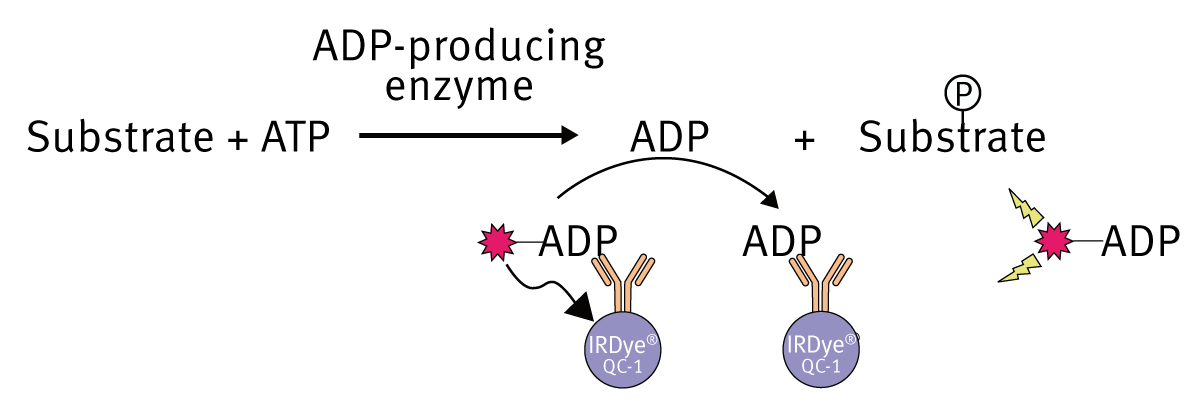
After the enzymatic reaction is finished, an ADP Alexa594 tracer bound to the ADP2 monoclonal antibody, which is conjugated to an IRDye® QC-1 quencher (licensed from LI-COR®), is added. Accumulated ADP from the reaction will eventually displace the ADP-tracer from the antibodyquencher complex into the solution. Here the ADPtracer complex becomes un-quenched resulting in an increase in fluorescence intensity. The ADP created during the enzyme reaction is proportional to the fluorescence signal
Materials & Methods
-
Black 384-well small volume plates from Greiner bio-one, Germany
- Transcreener ADP2 FI Assay Kit for 96-wells or 384-wells from BellBrook Labs
To show the potential of the instrumentation, ADP/ATP standard curves were created to mimic an enzyme reaction. For that 10 μM ADP and 10 μM ATP stock solutions were combined to give 15 standards with an ADP range from 0 to 10 μM. For 384-well plates the reaction mix consisted of 10 μL of ADP/ATP dilution and 10 μL of ADP detection mixture. The final concentration of tracer in the well was 4 nM. The final concentration of antibody conjugated to the QC-1 quencher depends on the ATP concentration. For the 10 μM ADP/ATP dilutions a final antibody concentration of 5 μg/mL per well was used as recommended in the Transcreener® manual. As controls, a high RFU control and a low RFU control were prepared:
High RFU control = Positive control
4 nM tracer in 0.5x buffer
Low RFU control = Negative control
Detection mix, 4 nM tracer and 5 μg/mL antibody conjugated to the QC-1 quencher
After the addition of the detection mixture to the standards a one hour incubation at room temperature follows. The plate was then inserted into a plate reader, the gain was adjusted to 10% of the positive control and fluorescence was measured.
Instrument settings
| CLARIOstar® | PHERAstar® FS | |
| Detection mode | Fluorescence Intensity | |
| Method | Endpoint, Top optic | |
| Optic settings | Monochromator settings: 575- 20/630-40 |
Transcreener specific FI optic module: FI 580 620 |
Data Analysis
The Z’-value, a standard for evaluating HTS methods, is calculated using the formula:
 where μp = mean of “positive control” (max ratio), μn = mean of “negative control” (min ratio), and σ = the corresponding standard deviations.
Results & Discussion
Figure 2 and 3 show a 15 point ADP/ATP standard curve monitored either on the PHERAstar FS or Omega plate reader in 384-well format.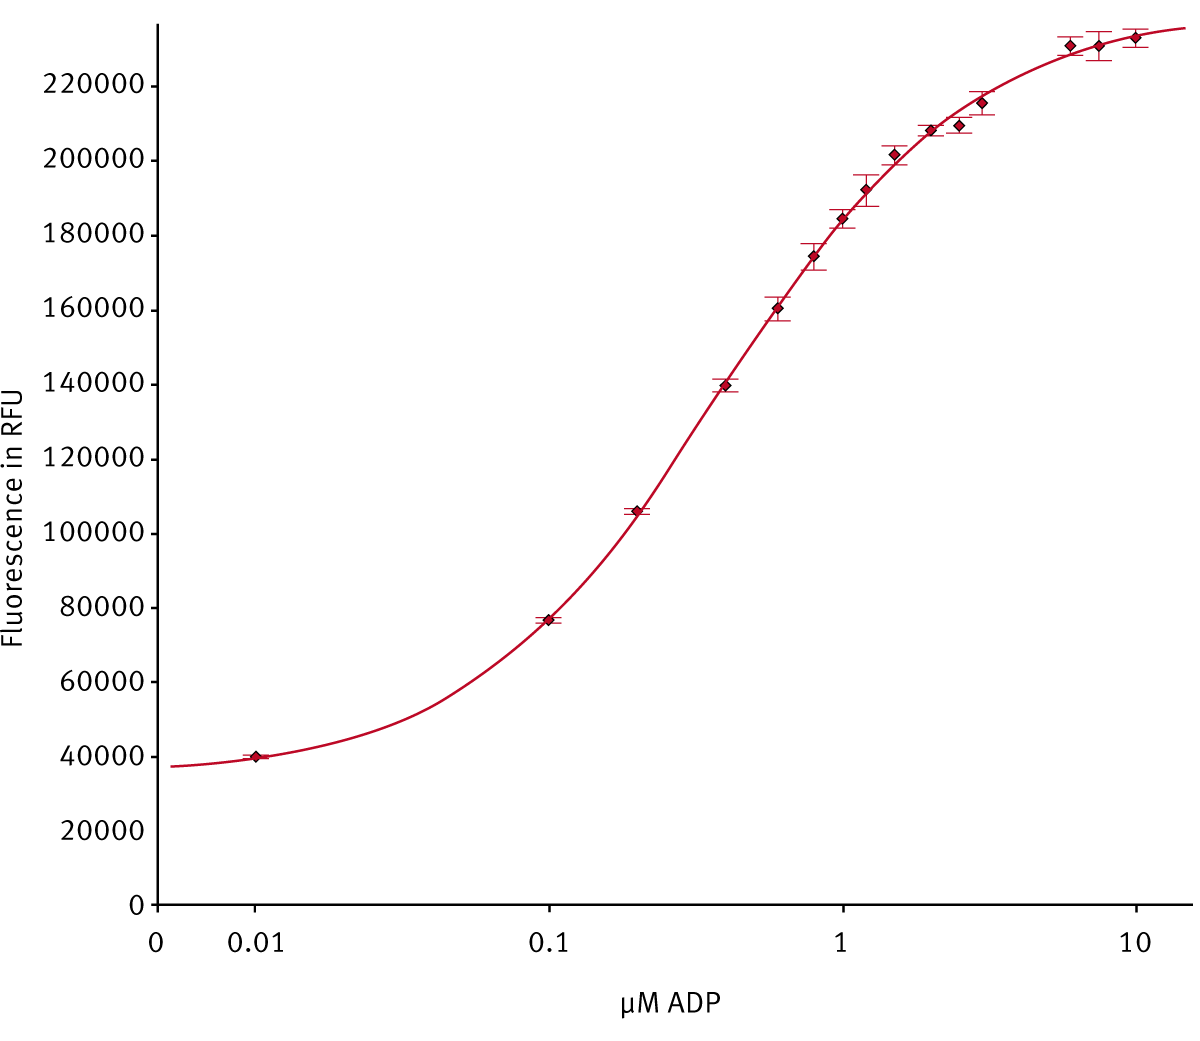
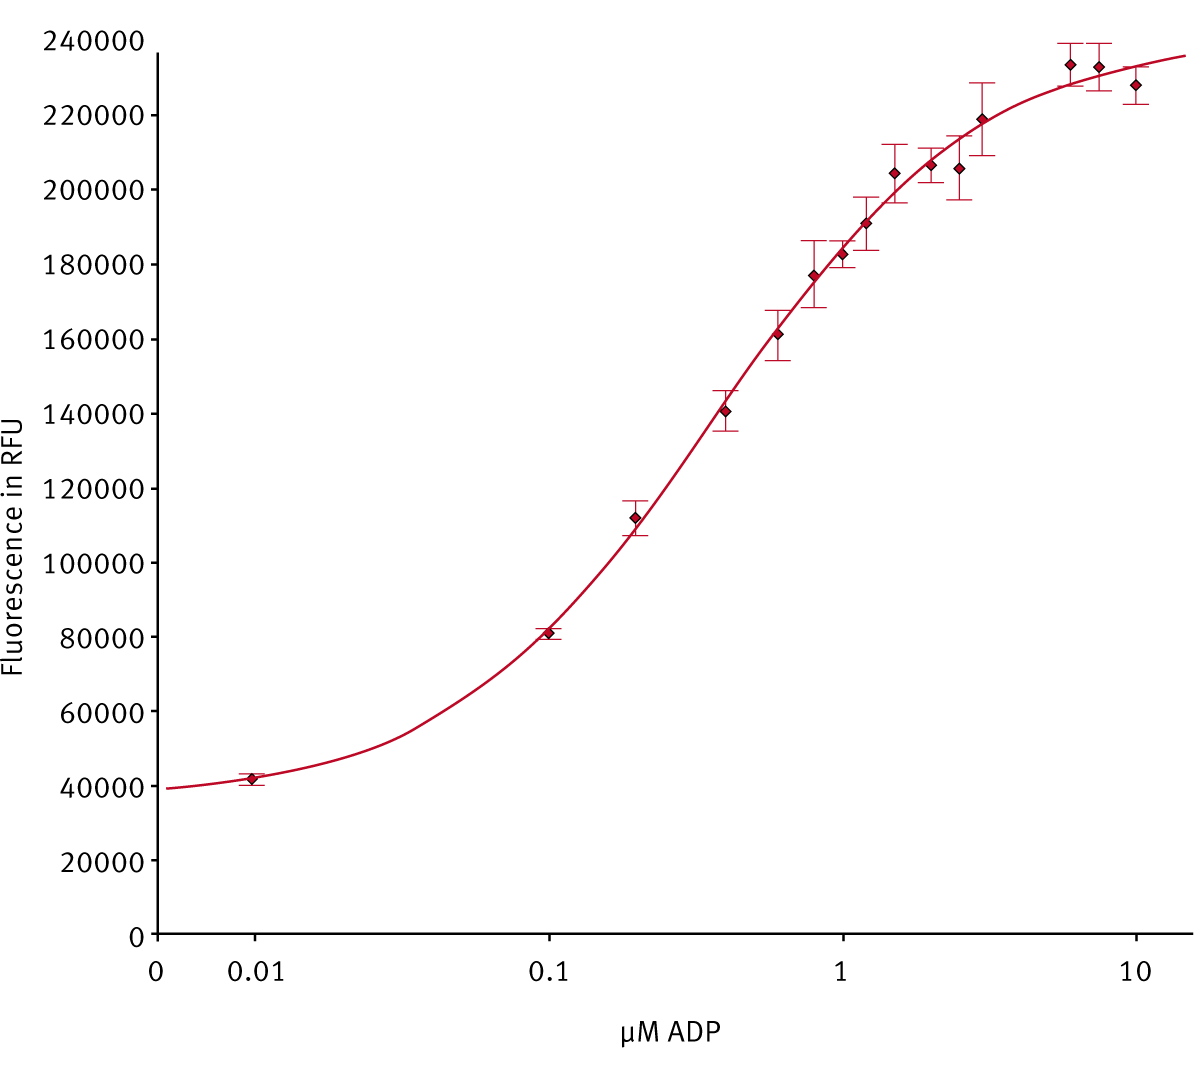
The standard curves for PHERAstar FS and CLARIOstar look very similar (data for CLARIOstar not shown). For the Omega the error bars are a slightly higher in the standard curve. This is due to the different optical system used in Omega instruments.
With the MARS Data Analysis Software that comes with every BMG LABTECH reader it is possible to calculate different assay parameters, like Z´values with just one mouse-click. Table 1 summarizes Z´value results for the different instrumentation.
Table 1: Z´ values for the Transcreener assay compared for different BMG LABTECH instrumentation
| PHERAstar FS | CLARIOstar | FLUOstar Omega |
|
| Z´value (384- well) at 10 % conversion using 5 flashes |
0.89 | 0.83 | 0.80 |
Table 2: CLARIOstar® assay performance at 10 % conversion 10 μM ATP
| Flashes | 1 | 2 | 3 | 4 | 5 |
| Read Times (min) whole 384 well plate | 1:23 | 0.83 | 1:43 | 2:02 | 3:01 |
| Z‘Factor at 10 % ATP conversion | 0.67 | 0.83 | 0.85 | 0.87 | 0.89 |
The criteria to get the Transcreener® FI certification is to achieve a Z’ factor of 0.7 at 10 % ATP conversion. As shown in Table 2 this Z’ value is already reached if only 5 flashes are used resulting in a read time of 1:31 for a whole 384-well plate. This indicates that measurements with the CLARIOstar using the LVF monochromators are fast and reliable at the same time.
Conclusion
We show that the Transcreener® ADP2 FI assay is compatible with the PHERAstar FS, the CLARIOstar and FLUOstar Omega.