Introduction
The tumour suppressor protein p53 is a transcription factor that plays a key role in response to carcinogenic stress and prevention of tumor development. Mutations in p53 are associated with 50% of all human cancers. p53 recognises a 20 bp DNA sequence consisting of two repeats of 5’-RRRCWWGYYY-3’ (where R=A or G; Y=C or T; W=A or T), separated by 0-13 bp. The genomic DNA in the cell often contains modified nucleotides, such as 5-methylcytosine. Using fluorescence anisotropy titrations, we studied the effect of modified nucleotides on the recognition of DNA by the tumour supressor p53 (Figure 1).
Assay Principle
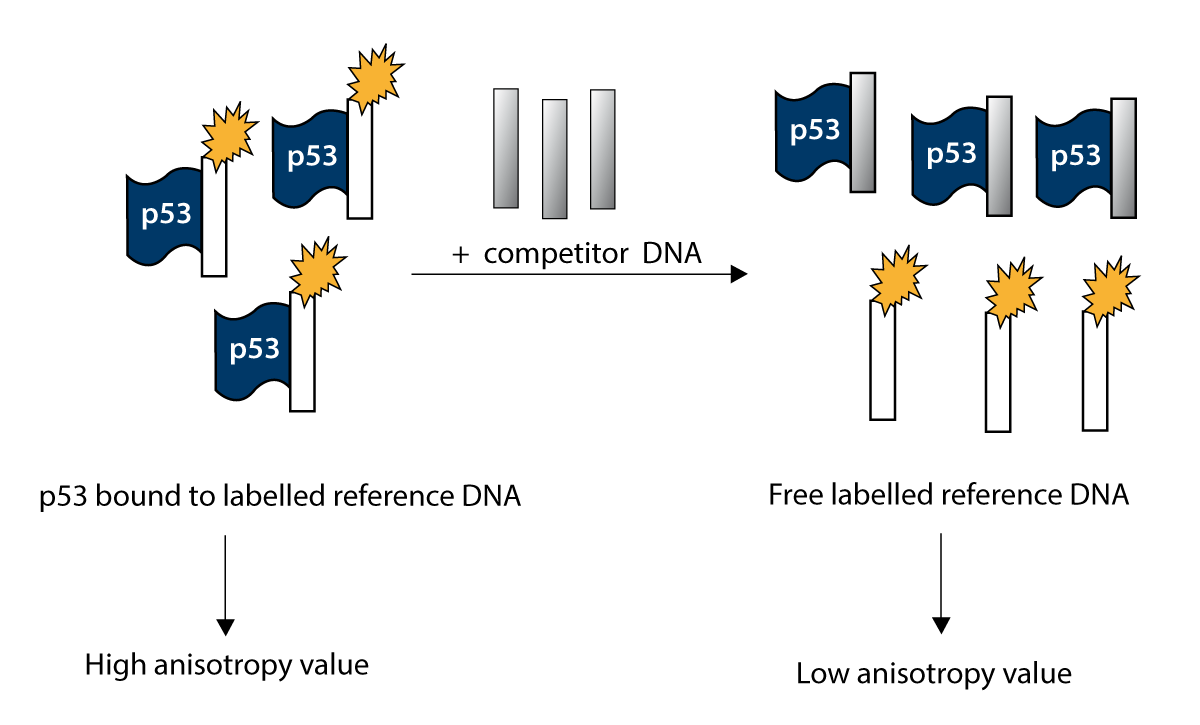
p53 binds to a labelled reference DNA resulting in a high anisotropy value. After adding of competitor DNA, the reference and competitor DNA will compete for the binding sites of p53. The competitor DNA will substitute the reference DNA depending on the binding affinity of p53 for it and depending of its concentration resulting in a lower anisotropy value.
Fluorescence anisotropy is the property of fluorescent molecules to retain the polarisation of the excitation light and reflects the tumbling rate of molecules in solution. It is ideal for studying protein- DNA interactions as the complex formed is larger and tumbles more slowly than the unbound oligonucleotide.
Here, we describe an experimental setup where the whole titration experiment is done in a single well. Such setup significantly improved data quality and allows full utilisation of the PHERAstar® FS HTS microplate reader from BMG LABTECH.
Materials & Methods
- Black 96-well microplates from Corning
- Oligonucleotides containing modified bases (competitor DNA) and Alexa488-labelled consensus oligonucleotide (reference DNA) from Eurogentec epMotion pipetting robot from Eppendorf
- Bravo liquid handling robot from Velocity 11
- PHERAstar FS from BMG LABTECH
The super-stable mutant of full length p53 was used. Oligonucleotide concentrations were measured and normalized to 1 mM prior to annealing. Oligonucleotides were annealed by heating to 95°C for 5 min and cooling at 1°C/min to room temperature and diluted to a final concentration of 50 μM.
DNA Binding experiments were done by fluorescence anisotropy at room temperature (25°C). The buffer conditions for the binding experiments were 25 mM phosphate buffer pH 7.2, 225 mM NaCl, 10 % v/v glycerol and 5 mM DTT. Total ionic strength was 286 mM. Bovine serum albumin (BSA, 0.2 mg/mL) was added to buffers to minimise non-specific binding of proteins. The concentration of labelled reference DNA was 20 nM. For measurements of the binding affinity of the reference DNA (direct titration), a p53 stock solution of 1.25 μM also contained 20 nM reference DNA so that the concentration of reference DNA was kept constant during the experiment. For competition experiments, 20 nM reporter DNA was mixed with full length p53 to a final concentration of 125 nM. A 25, 50 or 100 μM stock solution of competitor DNA was added in small aliquots to compete the reference DNA off the complex. In order to keep the concentration of reference DNA and p53 constant, the competitor DNA stock solution also contained labelled reference DNA and p53. Thus, only the concentration of the competitor DNA changes during titration. The DNA-binding experiments were multiplexed by performing titrations in black 96-well plates with a Bravo 96-channel pipetting robot interfaced with a PHERAstar FS microplate reader with a 485/520 nm fluorescence polarisation module. The detection mode settings were optimised for the focus position 2 mm below the maximum signal height. The sample volume during the titration was kept constant (200 μL): prior to addition of an aliquot of the binding protein (direct titration) or competitor DNA (competition experiments), an equal volume of sample was removed by aspiration. Each competitor DNA sequence was represented at least 3 times per plate. Each plate contained the reference sequence as a control.
The anisotropy values are automatically calculated using the following formula:
 whereas Ia is the parallel emission light and Ib is the perpendicular emission light.
Results & Discussion
The 22 bp palindromic reference sequence CGGACATGTCCGGACATGTCCG, consisting of representative p53 consensus sequence flanked by a single C or G nucleotide, was labelled at the 5´end with Alexa488 fluorophore. The results are presented in Figure 2.
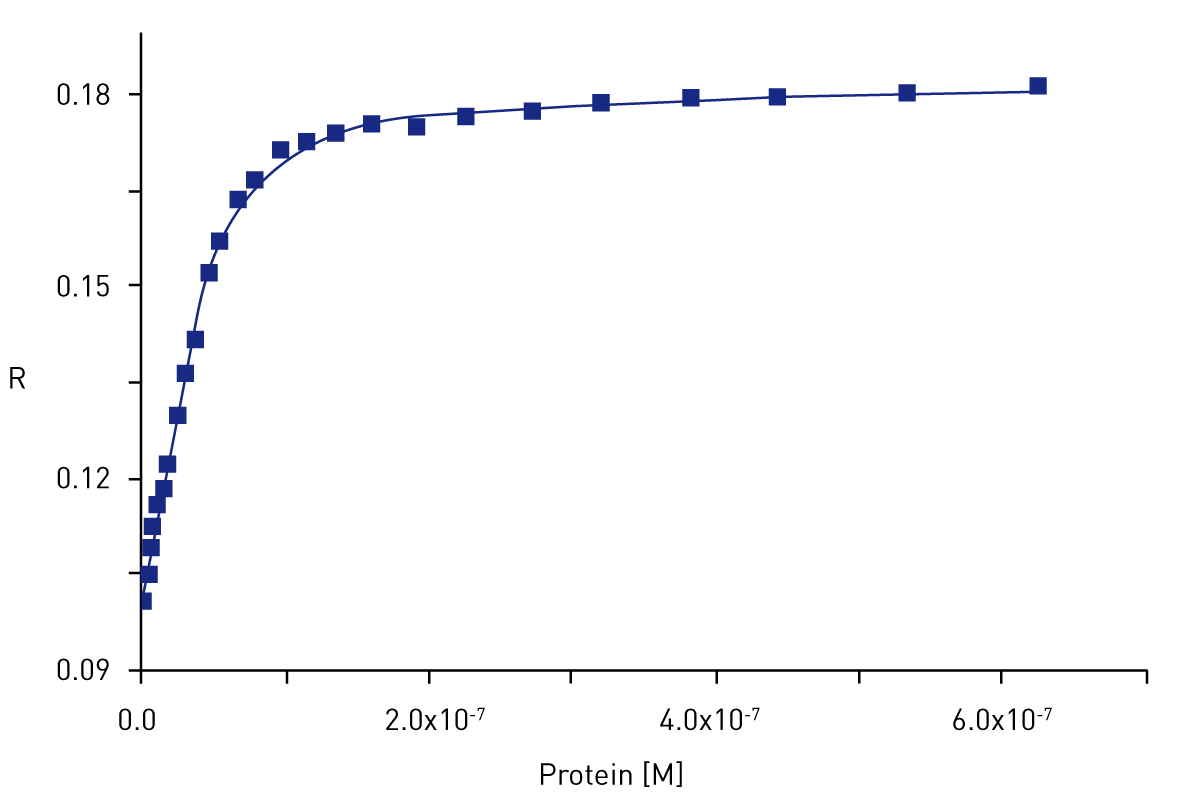
The analysis of the binding data according to a Hill equation (Figure 2, solid line) allows determination of Kd of interaction (Kd = dissociation constant of p53 from DNA sequence).
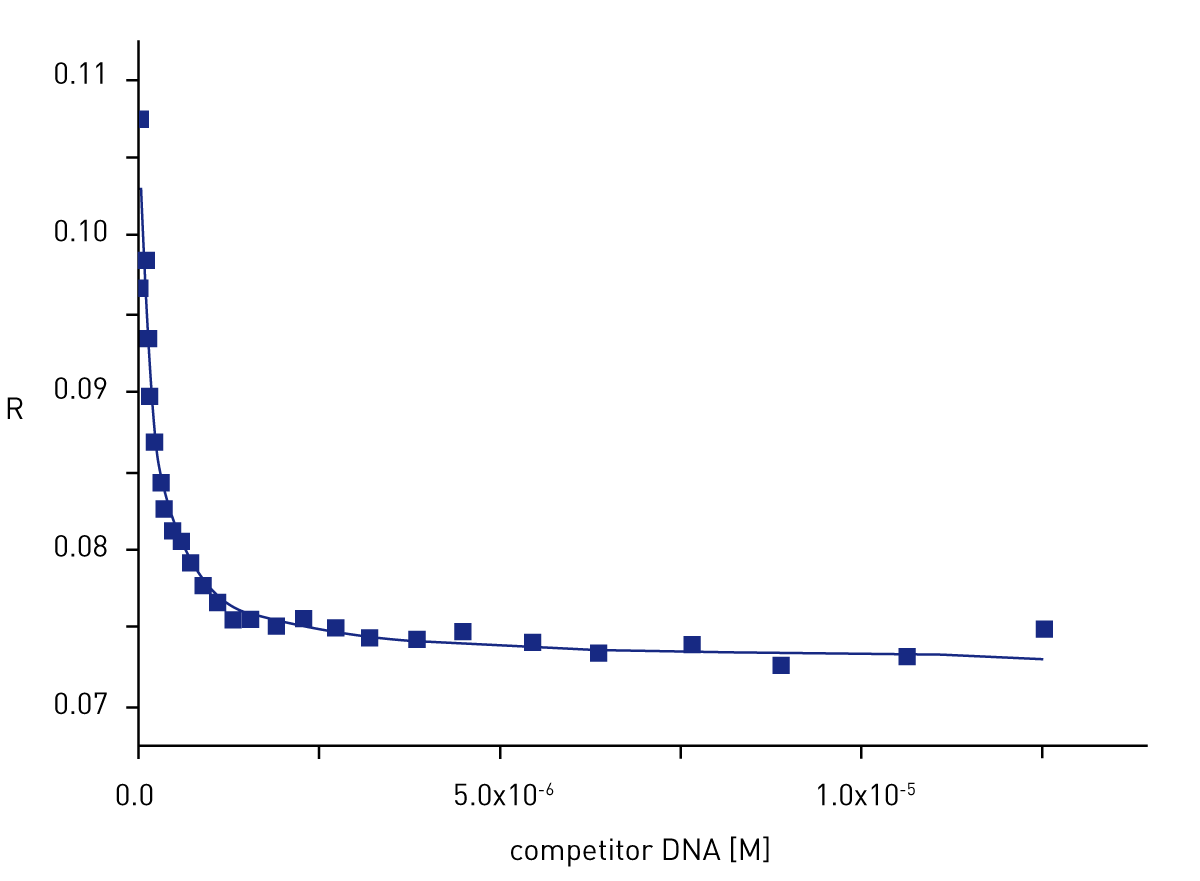
In subsequent experiments, we used a competition assay to improve the accuracy of determination of the difference in the affinity of the binding protein for the reference and competitor DNA (Figure 3). Analysis of the competition curve allowed accurate determination of the difference in affinity of the two nucleotides.
The results of the competition assay (an example is given in Figure 3) allow to determine the difference of Kd between two sequences. Such titrations were done for every DNA sequence studied.
 The binding affinity of a specific DNA sequence depended on the exact postion and nature nucleotide modification (Figure 4). The variations in the affinity were as much as one order of magnitude.
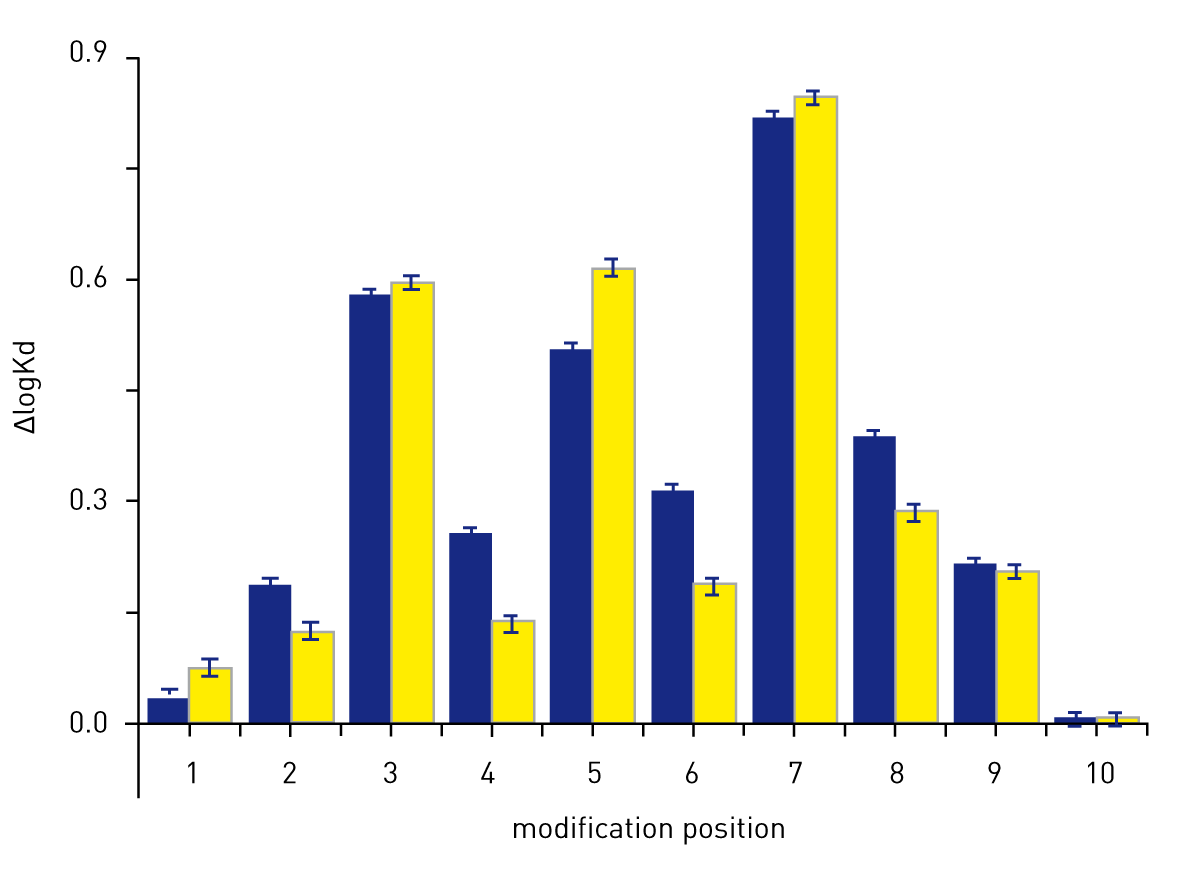
The difference in affinity relative to the unmodified reference sequence is shown by the DlogKd in Figure 4. The logKd of the reference sequence was -7.55. As an example, introduction of modified dinucleotides at positions 4 and 6 have a small overall impact on the affinity of p53 and result in the biggest modification specific response.
Conclusion
The PHERAstar FS from BMG LABTECH, interfaced with a liquid handling instrument, provides a powerful multiplexing platform for high throughput determination of binding affinities using fluorescence anisotropy. The sensitivity of the PHERAstar FS in the fluorescence polarisation mode allowed us to collect data suitable to accurate determination of Kd.