Introduction
Amyloid fibrils are implicated in a number of diseases, known as amyloidosis, including type II diabetes and Alzheimer’s disease. Each disease is associated with the misfolding of a particular protein into linear aggregates (fibrils) that accumulate in the body’s organs as plaques. Various different species may be formed during the aggregation process, including linear precursors known as protofilaments, which often appear in the early stages. There is evidence that amyloid formation could be a generic property of the polypeptide chain i.e. during appropriate (partially destabilising) conditions, ”any” protein will form amyloid fibrils. Despite this property, it is clear that the amino acid side chains contribute to the stability and the morphology of amyloid aggregates, as well as the kinetics of their formation. In this study, various mutants of an amyloid-forming protein V have been designed to investigate the effect of the mutation on the aggregation behavior.
One group of fluorescent dyes which have been shown to bind to amyloid fibrils are the anilinonaphthalene sulphonic acid’s (ANS). These dyes are not ”amyloid-specific”; they bind to proteins via exposed hydrophobic patches on the surface. In this study, the dye bis-ANS has been used to follow the aggregation process of protein V and mutants to give information about the kinetics and the hydrophobic properties of the formed amyloid aggregates.
In this report, we demonstrate that the BMG LABTECH microplate readers can monitor amyloid formation by performing fluorescence kinetics studies. We have made particular use of the script mode feature, allowing us to use a simple procedure for making timed ex situ measurements. The model protein V that has been used in this study is associated with amyloid disease.
Materials & Methods
Aggregation kinetics monitored by bis-ANS fluorescence
To prevent any interference of the aggregation process by including dye in the reaction mixture, ex situ measurements were made. Aliquots of the aggregation mixture were removed at various time points and added to a buffered solution of bis-ANS (obtained from Sigma- Aldrich for fluorescence measurements). This approach means that each well in the well-plate represents a single measurement in the kinetic assay. We have designed a script using BMG LABTECH’s Script mode that allows us to accurately probe the fluorescence properties at each time-point. The script runs a series of standard fluorescence protocols in a defined order allowing fluorescence measurements for consecutive wells. Additionally, it moves the wellplate in and out at appropriate times to assist sampling, and records the reaction time for each sample. By selecting the data to be exported to a CSV file, the results of the consecutive measurements (and the corresponding reaction times) can be recorded in a single file which can be opened and analyzed by a range of commercial and freeware programs.
Procedure
Buffer A: 10 μM bis-ANS in 50 mM sodium phosphate
buffer pH 7.4
Buffer B: 50 mM sodium phosphate buffer pH 7.4
i. Protocols, one for each well measured, should be prepared. The protocols themselves are all identical apart from the well number. The instrument settings are as shown:
- Type: Fluorescence Slow kinetics
- Excitation filter wavelength: 400nm
- Emission filter wavelength: 500nm
- Temperature: 30°C
- No shaking
ii. Select CSV file format – also select the following options:
- append data to the end of file (rather than replacing previous data)
- output filename as <ID1>
- report style such as Short Header which outputs the relevant variables e.g. our script uses <ID2> to represent the reaction time
iii. Insert the plate into the BMG LABTECH microplate reader
iv. Open script
v. Edit script: choose a filename for the CSV output i.e. <ID1>
vi. Save and run script (all actions are prompted by script from now on)
vii. Pipette 45 μL of A and 5 μL of B into the first well as a control.
viii. First measurement is made.
ix. Pressing enter starts a countdown. After 30 s a beep sounds – this is a prompt to start the aggregation by adding buffer B to protein V to a protein concentration of 30 μM.
x. Pipette 45 μL of A and 5 μL of aggregation mixture into the next well
xi. Measurement is made
Repeat x-xi until sufficient data has been collected, and then stop the script.
Final Bis-ANS fluorescence intensities for the different mutants Standard concentration curves were constructed. Various volumes (instead of 5 μl) of mature fibrils (30 μM) were added to 45 μl of buffer A. The concentration of bis-ANS was kept constant by the addition of buffer B to a final mixture volume of 50 μl.
Results & Discussion
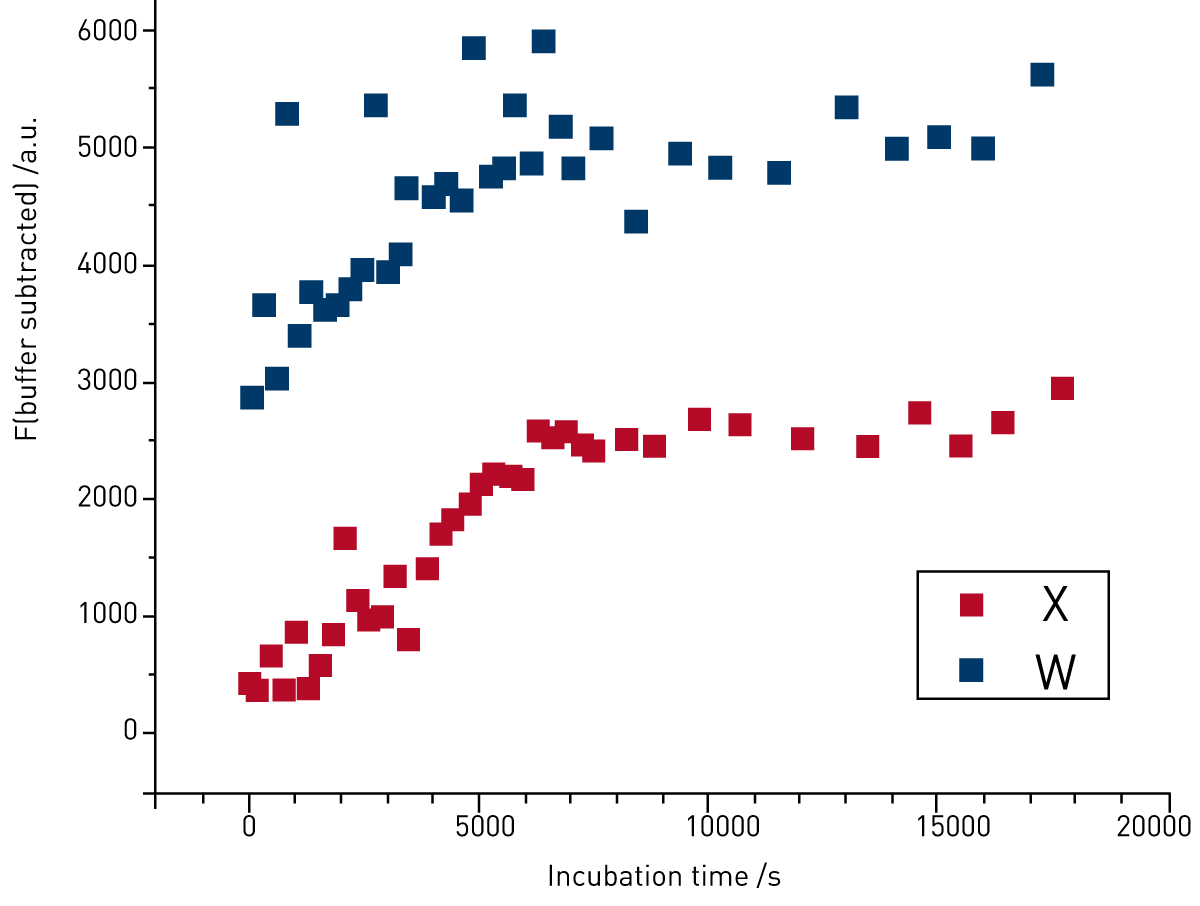
Figure 1 shows the kinetic plot of the aggregation process for two mutants of protein V (X and W). At time = 0 s protein X has a very low fluorescence signal, this increases until it reaches a fairly stable level at around 7000 s. The increase likely represents conversion of the monomer into mature fibrils with hydrophobic surfaces. The fluorescence with protein W increases over the same time-scale as protein X, however, the signal for protein W is consistently around 2500 a.u. higher than the signal for protein X. The non-zero initial fluorescence of protein W suggests the presence of aggregates, formed rapidly within the dead time of the experiment, that is able to bind bis-ANS. That these are not formed for protein X is interesting since it is generally thought that early oligomers represent the toxic species in amyloid diseases (rather than the fibrils). The higher fluorescence signal found for Protein W after stabilization of the bis-ANS signal suggests that the mature aggregated species formed from this mutant are also more hydrophobic than species formed from protein X. Differences in the hydrophobic nature between aggregated species are also interesting to study since a hydrophobic species could have the potential to mediate toxicity by interacting with the cell membrane in vivo.
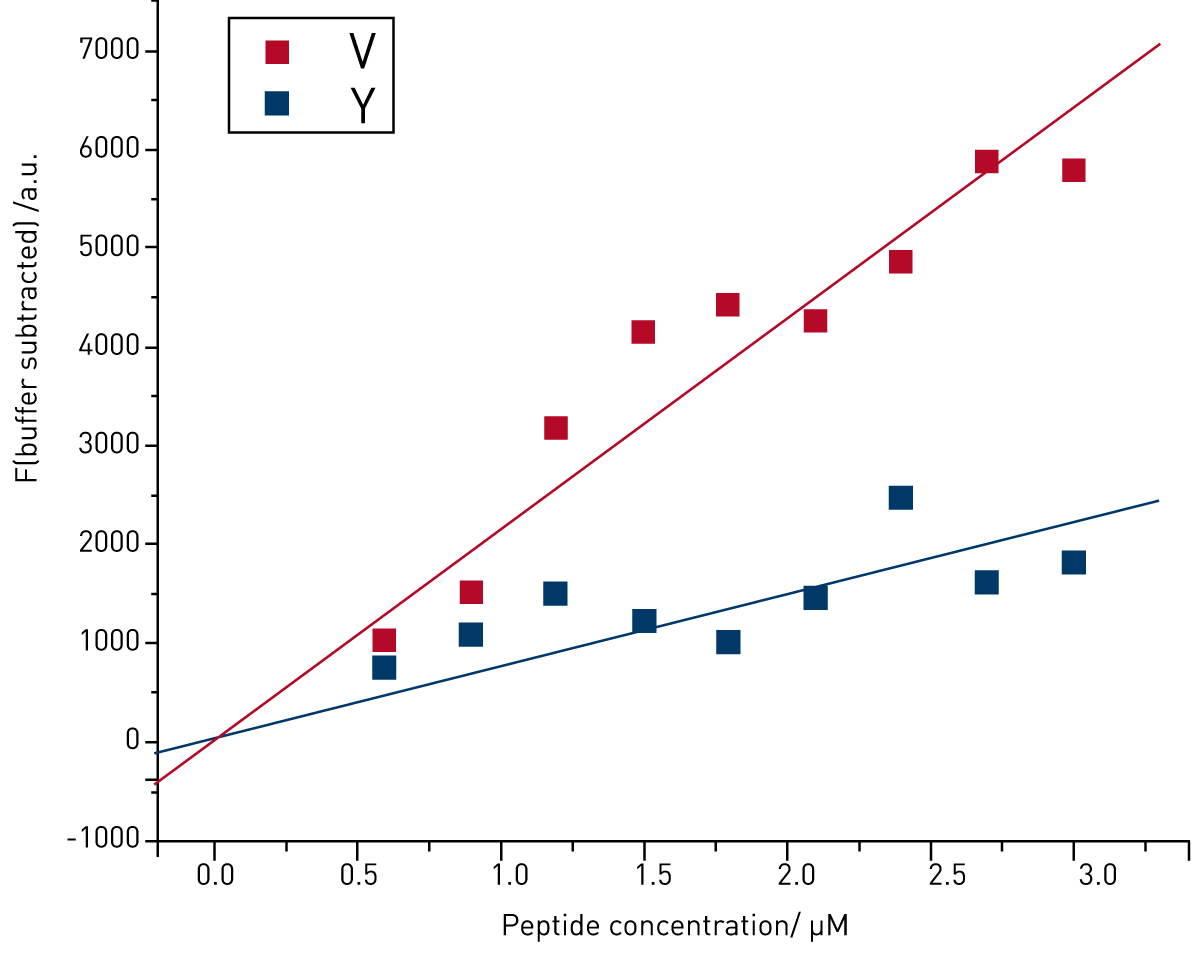
The bis-ANS binding of protein V and another mutant Y was also investigated at longer times. Proteins were left under aggregating conditions for 3 weeks allowing fibril formation. Aliquots were then removed to create a standard concentration curve for each protein (see Figure 2).
Linear fits to the data were made and the gradients and R values for each protein are shown in Table 1. A good fit was obtained for protein V, however, protein Y was poor despite a reasonably high fluorescence intensity. This may reflect a very heterogenous population of species (observed by TEM, data not shown). Protein Y also has a lower fluorescence signal than protein V, indicating that fewer hydrophobic surfaces are exposed.
.
| Protein |
Gradient | R |
| V | 2135 ± 91 | 0.95 |
| Y | 740 ± 76 | 0.72 |
Conclusion
In this report, we have demonstrated that BMG LABTECH microplate readers can be used to follow protein aggregation kinetics using fluorescence measurements. In particular, we have shown that using the script mode it is possible to make timed ex situ measurements fairly simply, creating an output into a single CSV file.