Introduction
Transcreener® assays from BellBrook Labs offer generic, universal HTS assays for nucleotide detection like ADP, UDP, GDP and AMP. These assays are available in three detection modes - Fluorescent Polarization (FP); Fluorescent Intensity (FI) and Time-Resolved Fluorescence Resonance Energy Transfer (TR-FRET).
The PHERAstar series of microplate readers are perfect for all three detection formats. For FP and TR-FRET it uses a unique Simultaneous Dual Emission detection system that measures both emission wavelengths in one read of the microplate. Simultaneous Dual Emission detection not only reduces plate read times by half, it corrects for any signal variations due to differences in well volumes, concentrations, or fluctuations in excitation energy.
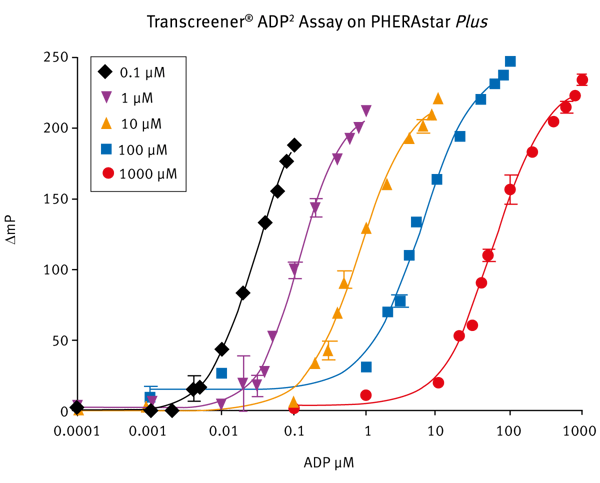
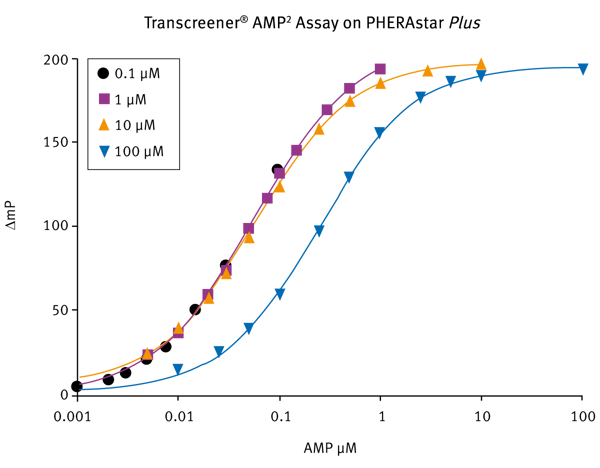
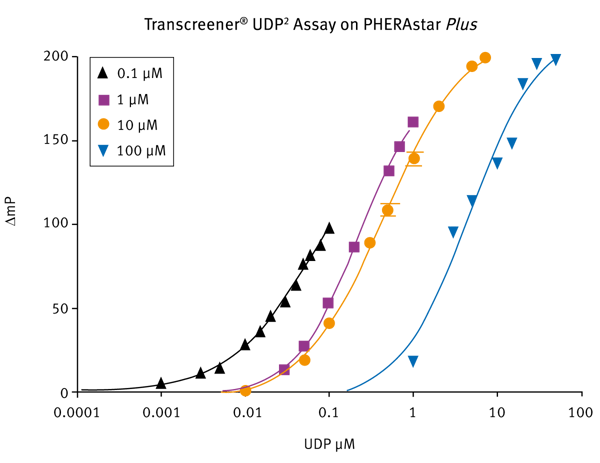
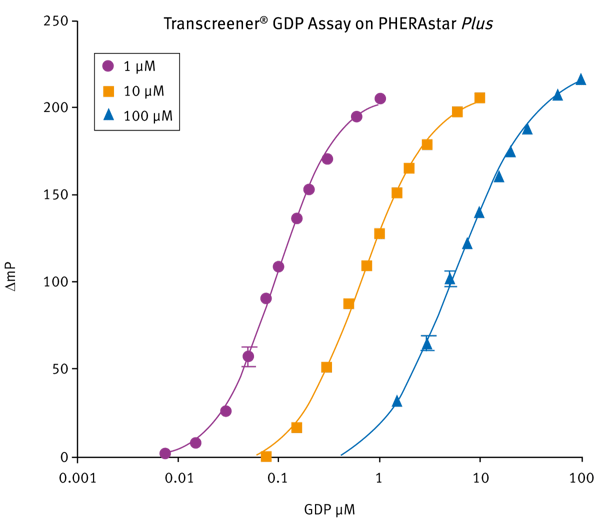
In this appication note we show the performance of PHERAstar FS for detection of different nucleotides in the Transcreener® FP assay. The instrument can achieve a Z’ >0.8 and a Δ mP greater than 100 at 10% conversion for all the Transcreener® assays tested with 10 μM respective standard curve.
Assay Principle
Materials & Methods
- Transcreener XMP Detection Reagents
- Black 384-well plates from Corning
- PHERAstar® FS microplate reader (BMG LABTECH)
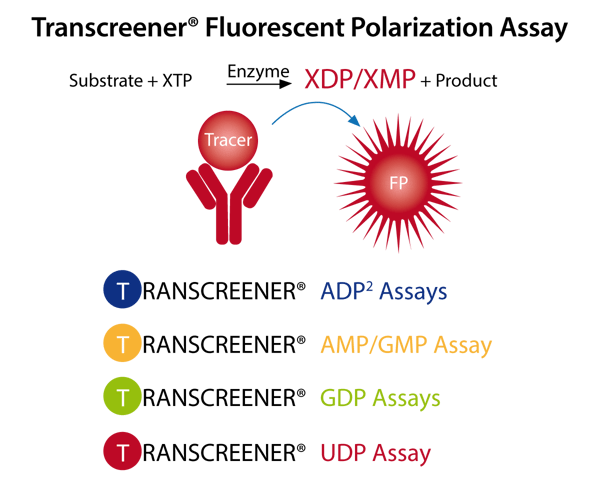
Representative for all XDP Transcreener assays the ADP2 assay is explained in more detail. As the ratio of ADP:ATP increases, the proportion of bound tracer versus free tracer decreases, resulting in an overall decrease in mP values. A 15-point standard curve was prepared as described below:
1. Dispense 10 μL of each ATP/ADP combination across an entire row of the black 384-well plate.
2. Add 10 μL of ADP Detection Mix to those rows.
3. Dispense 10 μL of the 10 μl ATP/0 μM ADP combination into row P.
4. Dispense 10 μL of free tracer into wells P1 to P12.
5. Dispense 10 μL of buffer blank into well P13-P24.
For the FP measurement the Transcreener specific FP modul should be installed. The excitation wavelength is at 590 nm and both emission wavelengths are at 675 nm. A focus and Gain Adjustment should be done, while setting the target mP value to 20 mP using a well that contains only the free tracer.
Results & Discussion
Table 1: Table shows Z’ values for 10 μM ATP/ADP; 10 μM ATP/AMP; 10 μM UDP Glucuronic Acid/UDP and 10 μM GTP/GDP generated in PHERAstar FS. The highlighted values show the Z’ at 10% conversion demonstrating a superior assay performance in BMG LABTECH’s PHERAstar FS.
|
% Conv |
ADP2 Assay |
AMP2 Assay |
UDP2 Assay |
GDP Assay |
|
20 |
0.88 |
0.92 |
0.86 |
0.86 |
|
10 |
0.85 |
0.93 |
0.91 |
0.86 |
|
5 |
0.82 |
0.93 |
0.85 |
0.81 |
|
4 |
0.77 |
|
|
|
| 3 |
0.74 |
0.86 |
0.83 |
|
| 2 |
0.58 |
0.55 |
0.57 |
0.67 |
Table 2: Read Times for the PHERAstar series of microplate readers in Fluorescence Polarization Mode (10 flashes, different microplate formats).
| Fluorescent Polarization Read Times (10 flashes) | ||
|
|
PHERAstar |
Reader with No Simultaneous Dual Emission Detection |
|
384-well |
0:85 |
≥ 1:16 (0:38 x 2) |
|
1536-well |
0:82 |
≥ 3:44 (1:52 x 2) |
|
3456-well |
9:47 |
≥ 19:34 (9:47 x 2) |
Conclusion
Bellbrook Labs offers four Transcreener assays for direct detection of ADP, AMP/GMP, UDP and GDP. Excellent Z’ values and large signals are shown for low percent conversion with all the four assays using BMG LABTECH`s PHERAstar FS.
This application note demonstrates the validation of the BMG LABTECH PHERAstar FS instrument for use with the Transcreener FP Assays. By utilizing the optimized instrument settings suggested within this Application Note, Z’ values > 0.7 and ΔmP values > 120 at 10% conversion are achievable.


