Introduction
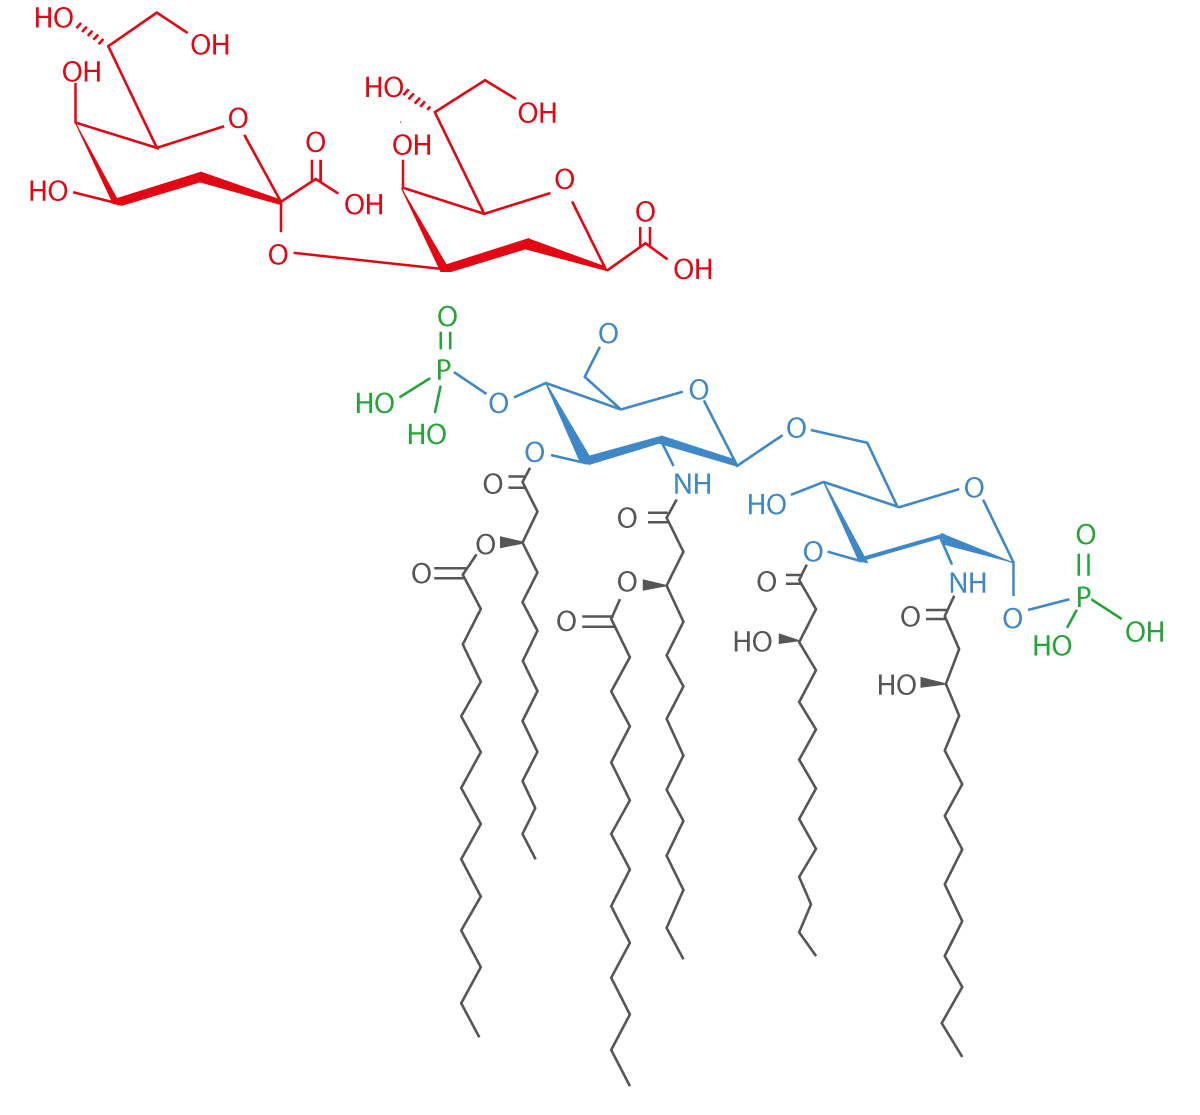
Endotoxins or lipopolysaccharides (LPS) are undesirable byproducts of gram-negative bacterial preparations often found in plasmid DNA and ovalbumin preps. LPS is located in the outer membrane of the bacterial cell. Even trace amounts cause a signifi cant inflammatory response. The presence of endotoxin in the blood (endotoxemia) can lead to sepsis in mammals. Therefore, endotoxin detection is essential to ensure elimination of endotoxin from DNA and protein preparations to avoid unwanted responses in in vivo and in vitro assays.
 For endotoxin quantification, Lonza has developed a kinetic endotoxin detection kit, which utilizes the coagulation properties of horseshoe crab blood in the presence of even low levels of endotoxin. The clottable protein was isolated and is the active component of the Limulus Amebocyte Lysate (LAL) in the endotoxin detection kit. In the presence of endotoxin, a proenzyme in the LAL is activated which cleaves a colorless peptide, Ac-Ile-Glu-Ala-Arg-pNA, releasing p-nitroaniline (pNA) which can be detected by continuous absorbance measurements at 405 nm.
Assay Principle

Endotoxin detection is achieved and the concentration of endotoxin is calculated by comparing reaction times of samples to solutions of known amounts of endotoxin.
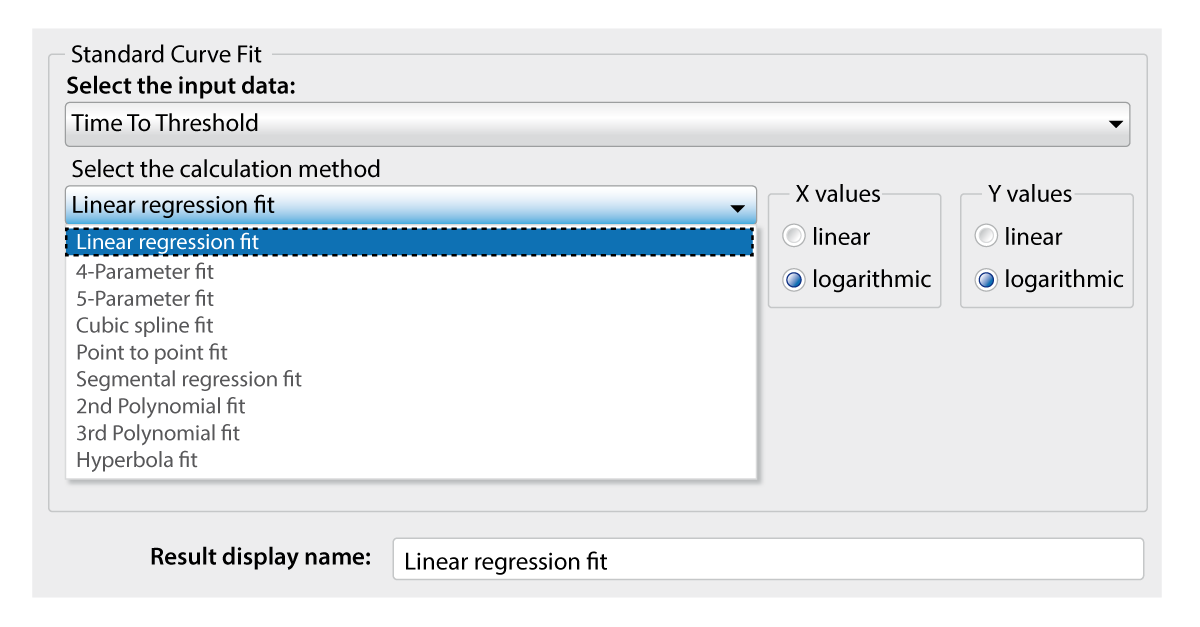
The reaction time is typically defined as the time it takes to produce a 0.2 OD change in absorbance at 405 nm. The endotoxin concentration is inversely proportional to the reaction time so a smaller reaction time indicates a higher endotoxin concentration. The microplate reader measures the kinetic endotoxin detection kit readily and in conjunction with MARS data analysis software can produce reaction times. MARS can also plot the standards and interpolate unknown samples from a linear regression or polynomial fit.
Materials & Methods
- Corning 96 well Microplate, Clear
- Lonza Kinetic-QCL Endotoxin Kit
- Filter-based or spectrometer equipped microplate reader from BMG LABTECH
100 μl of standards and unknowns were measured with the detection reagent for absorption at 405 nm in duplicate for a total of 100 min in plate mode (slow kinetics). After reagent addition a reading was taken every 2.5 min for a total of 40 points. Standards included 0.005, 0.05, 0.5 and 5.0 EU/ml, where EU = endotoxic units, a comparative measure of endotoxin activity. Since a baseline correction is applied, blanks are not required for optimal assay performance when using a kinetic endotoxin detection kit.
Instrument settings
| Detection Mode: | Absorbance, plate mode kinetic |
| Optics: | 405 nm |
| No. of cycles: | 40 |
| Cycle Time: | 150 sec |
Here you will find the protocol file for BMG LABTECH’s Smart Control Software (CLARIOstar Plus and VANTAstar), the used plate layout and the corresponding templates for automatic evaluation of generated data in MARS. You can download these files from the overview page, import them into your BMG LABTECH software and use them to evaluate your analysis.
Results & Discussion
The absorbance measurements over time resulted in different signal curves (fig. 2).
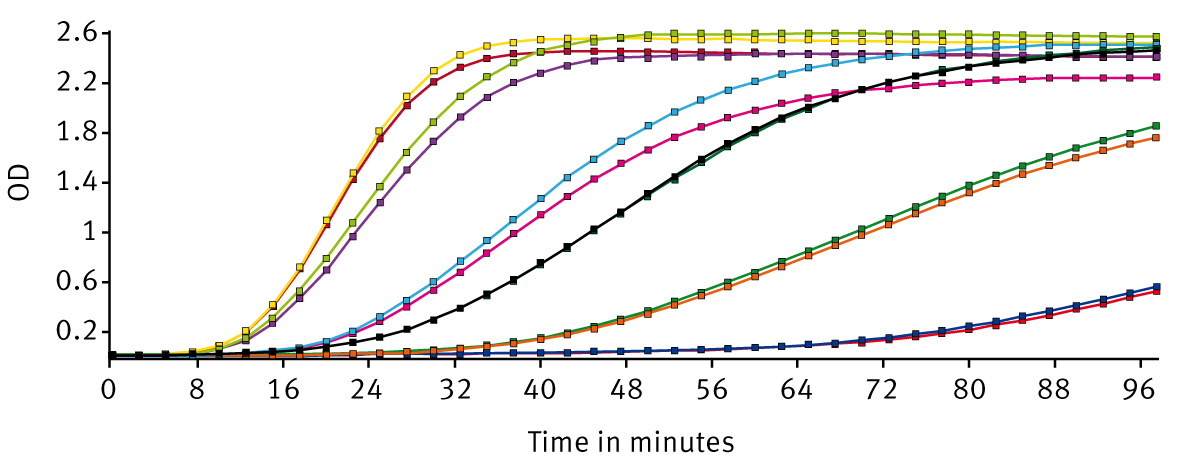
The kinetic data of the endotoxin detection kit was evaluated utilizing the MARS data analysis software from BMG LABTECH. A baseline correction was applied to the raw data by subtracting cycle 1. The reaction time was calculated by performing a “time to threshold calculation” on the baseline corrected raw data generated with the endotoxin detection kit. The threshold value was set for 0.2 OD yielding a reaction time in seconds. The average reaction time was plotted against concentration in EU/ml using a linear regression model (Fig. 3).
 The resulting standard curve fit had an R2 value of 0.999 allowing for reliable interpolation of unknown samples (Table 1).
| Sample | [Endotoxin], EU/ml calculated from Linear Regression Fit |
| Unknown 1 | 4.59 |
| Unknown 2 | 0.38 |
Alternatively, the MARS data analysis software facilitated the plotting of standards utilizing a polynomial curve fit. It is recommended that the polynomial order be one less than the number of standards used. For this endotoxin detection kit, a 3rd order polynomial fit could be used.
The MARS data analysis software further allows for the creation of a template for the analysis of the endotoxin detection kit and other sophisticated calculations (Fig. 4) to provide immediate data reduction and curve fits as soon as the assay is completed.
Conclusion
The combination of sensitive microplate readers and the powerful MARS data analysis package allows for easy handling of complex assays such as the Kinetic-QCL endotoxin detection kit from Lonza. The MARS data analysis package is standard with all BMG LABTECH readers and can be installed on other computers in the same lab at no additional charge. This endotoxin detection kit can also be measured by all BMG LABTECH microplate readers that measure absorbance including the SPECTROstar® Nano, PHERAstar® FSX, FLUOstar® Omega, VANTAstar® and CLARIOstar® Plus.