Introduction
Ellman’s reagent is 5,5’-dithio-bis-(2-nitrobenzoic acid), also known as DTNB, a compound used for quantitating free sulfhydryl groups in solution (Fig. 1). A solution of this compound produces a yellow-colored product when it reacts with sulfhydryl groups. This yellow-colored product can be quantified using a spectrophotometer based on its strong absorbance at 412 nm (1,2).

Thiol chemistry is a rapidly expanding field in basic and applied bioscience. As a consequence, the quantitative measurement of -SH groups is a routine task in many applied disciplines where a quick and easy method is much preferred3. Electrochemical and fluorimetric assays are very sensitive and accurate but they involve lengthy procedures (complete proteolysis, electrolysis, HPLC separation). Although spectrophotometric thiol assays such as Ellman’s are less sensitive in comparison, they are rapid and simple and are therefore more popular for the quantification of sulfhydryls.
Assay Principle
DTNB reacts with a free sulfhydryl group to yield a mixed disulfide and 2-nitro-5-thiobenzoic acid (TNB; see Figure 2). The target of DTNB in this reaction is the conjugate base (R—S-) of a free sulfhydryl group. TNB is the “colored” species produced in this reaction and has a high molar extinction coefficient in the visible range. The molar extinction coefficient of TNB is reported to be 13,600 M-1cm-1 at 412 nm and pH 8.0.
 Sulfhydryl groups may be estimated in a sample by comparison to a standard curve composed of known concentrations of a sulfhydryl-containing compound such as cysteine. Alternatively, sulfhydryl groups may be quantitated by reference to the extinction coefficient of TNB.
Materials & Methods
- Flat-Bottom 96-well plate (NUNC)
- SPECTROstar Nano
- Reaction Buffer (RB): 0.1 M sodium phosphate, pH 8.0, containing 1 mM EDTA
- Cysteine Hydrochloride Monohydrate (MW 175.6) Ellman’s Reagent 5,5-dithio-bis-(2-nitrobenzoic acid)
Experimental Procedure
Thaw Ellman’s Reagent and Cysteine to room temperature prior to use. Prepare Ellman’s Reagent Solution by dissolving 4 mg thawed Ellman’s Reagent in 1 mL RB.
- Dissolve Cysteine Hydrochloride Monohydrate in RB to make Standard A (1.6 mM). Prepare a set of cysteine standards by diluting Standard A in 2-fold dilution series to 0.1 mM.
- Prepare at least 2 1:10 dilutions of the unknowns.
- Prepare a set of test tubes, each containing 50 µL of Ellman’s Reagent Solution and 2.5 mL of RB
- Add 250 µL of each standard or unknown to the separate test tubes prepared in step 3.
- Mix and incubate at room temperature for 15 minutes. Add 200 µL of each solution to a 96-well plate.
- Use the SPECTROstar Nano to take a full absorbance spectrum of the compound
Instrument settings
|
Optic Settings |
Absorbance, endpoint |
|
|
Wavelength settings |
Spectra: |
250-500 nm |
|
Resolution: |
2 |
|
|
Pathlength correction |
On, volume 250 µl |
|
|
Speed and precision |
precise |
|
- Plot the OD values obtained 412 nm for the standards to generate a standard curve. Determine the experimental sample concentrations from this curve using the formula below.

Results & Discussion
Cysteine Standard Curve
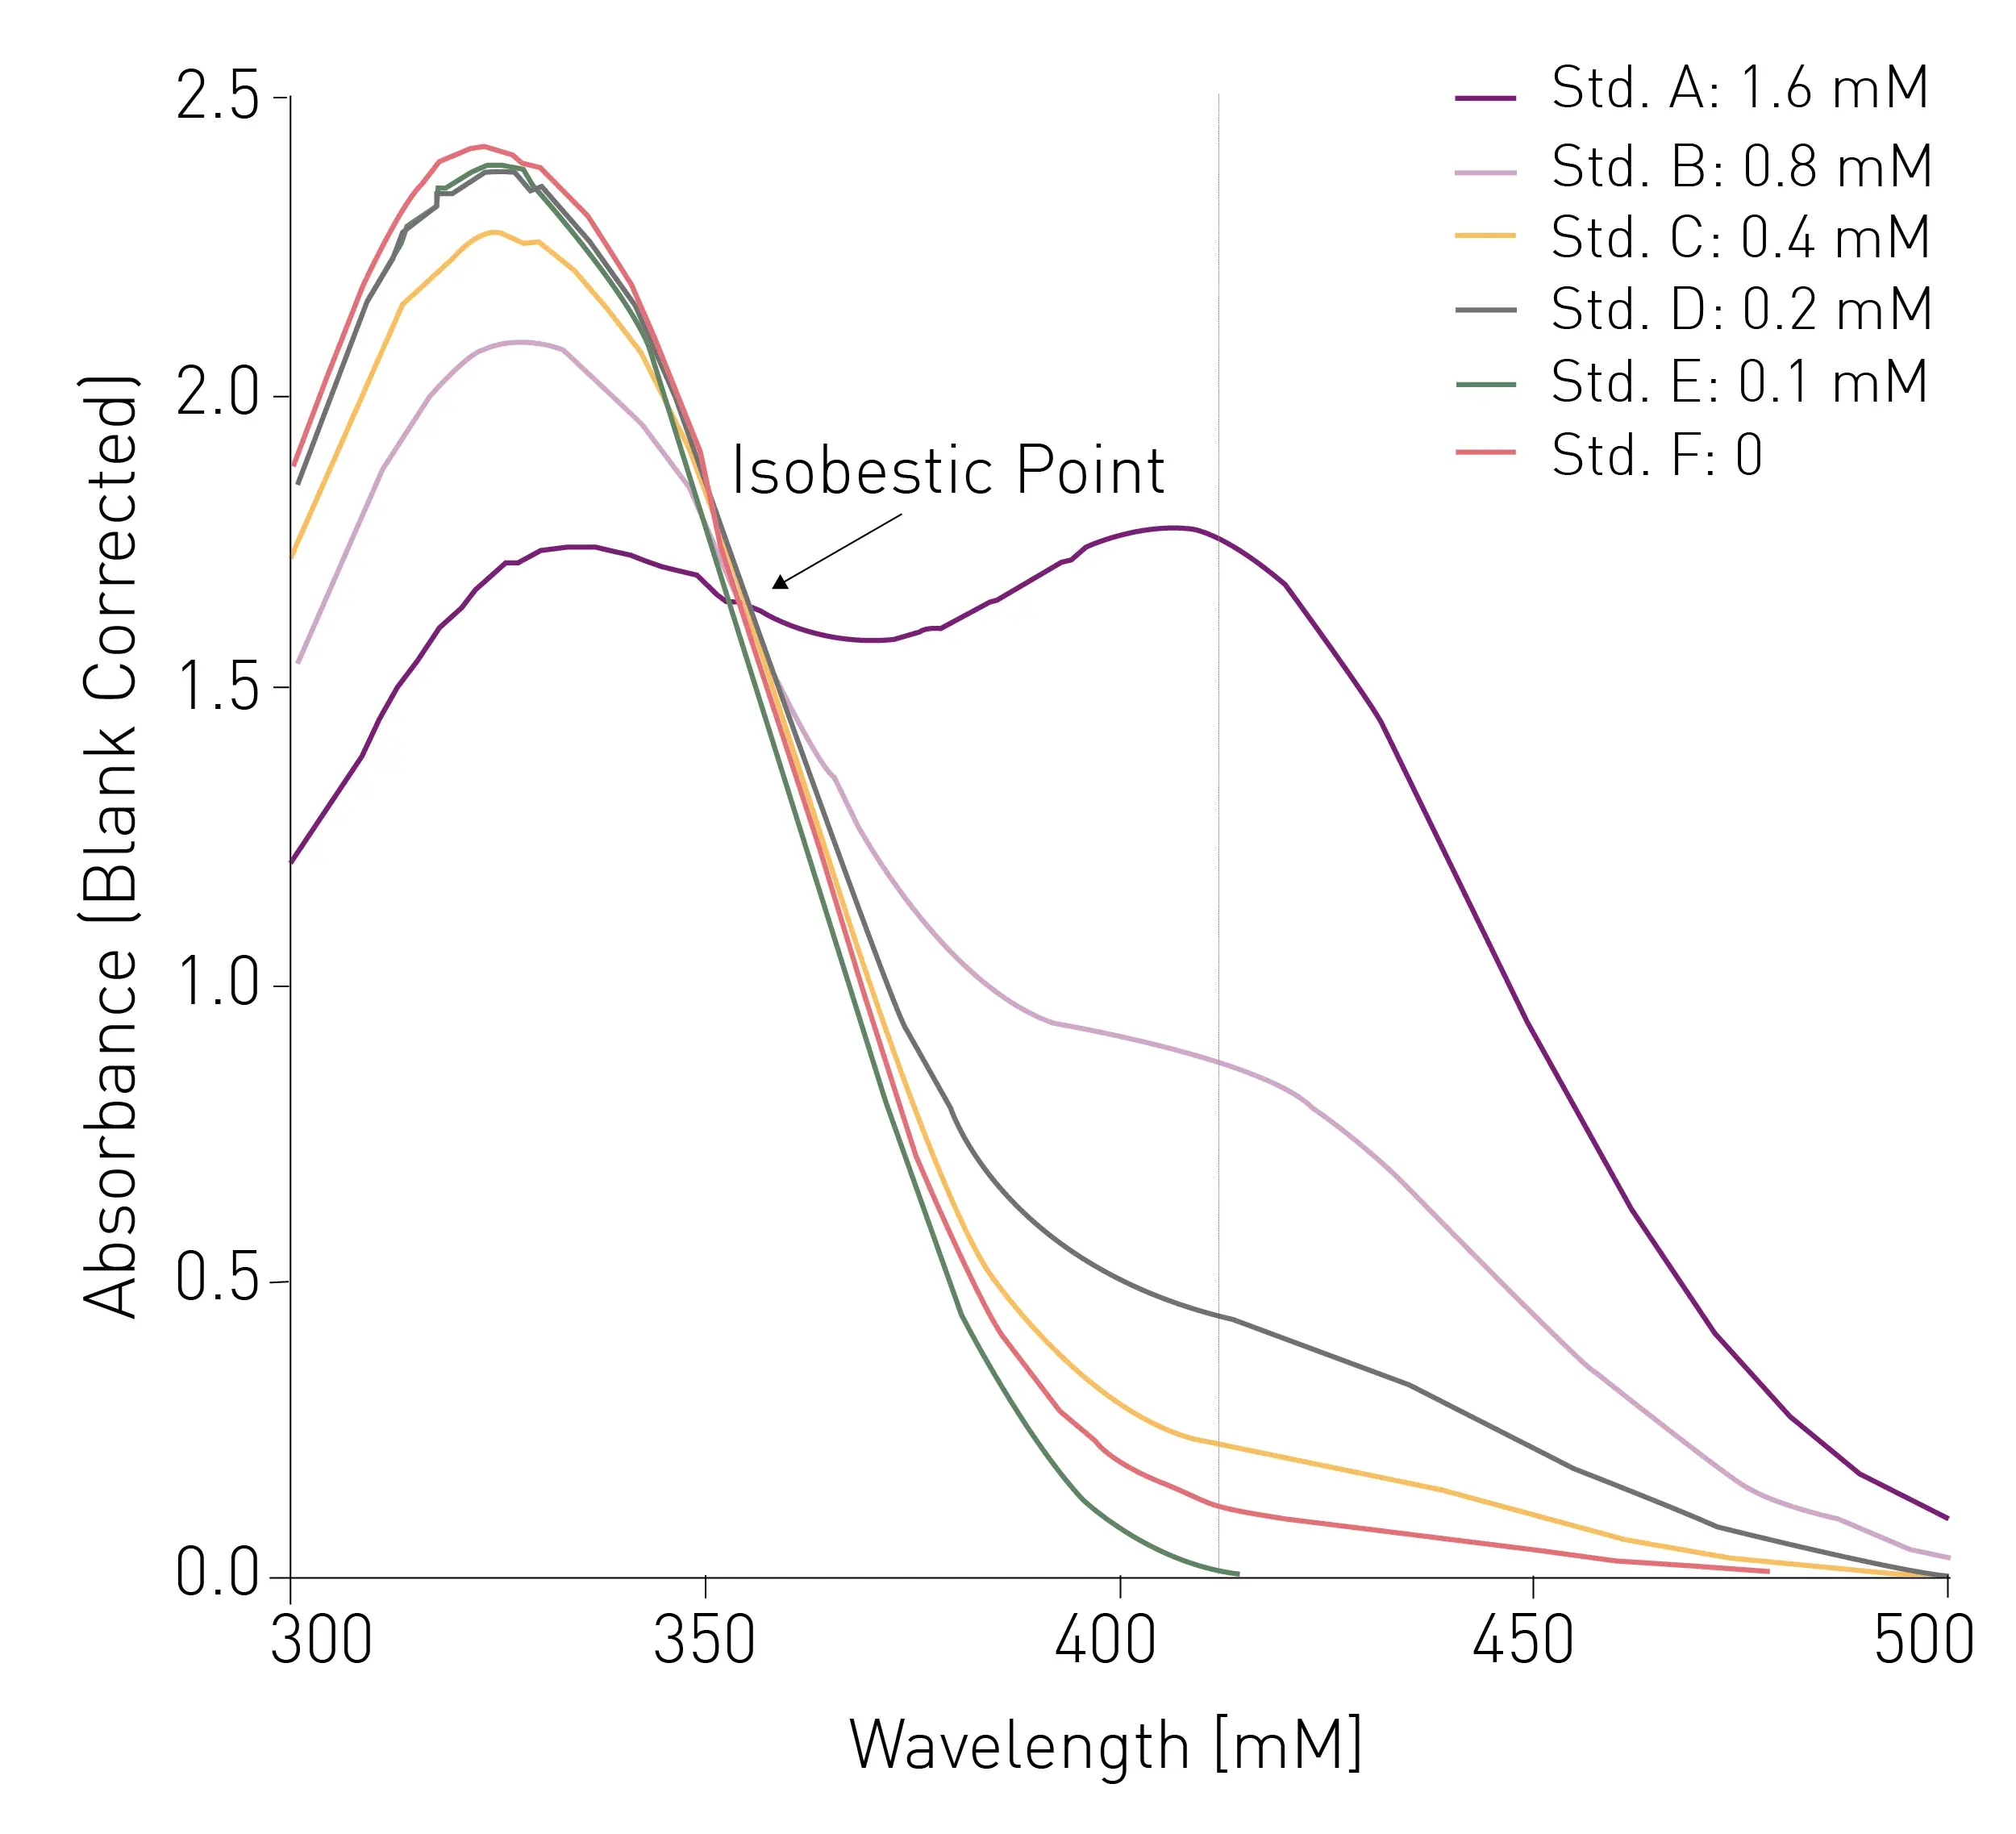
The standard curve itself can be a useful indicator of the strength of the assay. By taking the full spectrum of absorbance values for each solution, the isosbestic point can be determined either tabularly or graphically to confirm the molar ratio between the Ellman’s Reagent and test sample are equivalent across each test solution. The isosbestic point for Ellman’s assay is approximately 356 nm (Figure 3). A smooth peak at 412 nm also indicates that your solution falls within the working range of the assay.
Calculating Sulfhydryl Concentrations of Unknown Solutions
Similarly, the absorbance spectra of the unknown solutions can be compared to those of the standard curve to ensure that the concentrations of the solutions fall within the range of the standard curve (Figure 4). The absorbance values for Unknown Solutions A and B were plotted along the standard curve, corresponding to a sulfhydryl concentration of 1.234 mM and 0.810 mM, respectively (Figure 5).


Conclusion
Ellman’s assay is a useful tool that can be used to determine the sulfhydryl concentration of unknown solutions. The assay can also be adapted to accommodate larger volumes of test sample for readings in a cuvette by using Beer’s Law and the extinction coefficient of TNB.
Ellman’s Reagent may be used for applications other than the estimation of sulfhydryls in solution. It has been used for the determination of alkylthiols by HPLC using a pre-column derivatization procedure and to study thiols in the active site of several enzymes including thiolase fatty acid synthase and mevalonate 5-diphosphate decarboxylase. as reduction in compound and sample/cell usage.
References
- Thermo Scientific. (2011). Ellman’s Reagent
- IUPAC. Compendium of Chemical Terminology, 2nd ed. (the “Gold Book”). Compiled A.D. McNaught and A.
- Riener, C. K., Kada, G., & Gruber, H. J. (2002). Quick measurement of protein sulfhydryls with Ellman’s reagent and with 4,4’-dithiopyridine. Analytical and Bioanalytical Chemistry, 373(4-5), 266-276.