Introduction
Peptidoglycan is an important structural component of the bacterial cell wall. The continual synthesis of peptidoglycan and remodelling of the cell wall is essential for most bacteria. Since the enzyme phosho-N-acteylmuramoyl-penta-peptide translocase (MraY) catalyzes one of the last cytoplasmic steps in the peptidoglycan biosynthesis, it represents a target for antibacterial drugs. This integral membrane protein catalyzes the attachment of soluble UDP-N-acetyl-muramoylpentapeptide (UNAM-pp) to the lipid undecaprenyl phosphate (C55P) which is membrane bound.
Assay Principle
In this application note, we want to present a novel homogeneous FRET-based assay to monitor the activity of MraY. A donor fluorophore (BODIPY-FL) is attached to UNAM-pp (B-UNAM-pp) while the acceptor fluorophore-labelled 1,2-dipalmitoyl-sn-glycero-3-phosphoethano-lamine-N-(lissaminerhodamine B sulfonyl) (LRPE), is embedded in micelles which also contain MraY and the lipid substrate C55P (Figure 1).
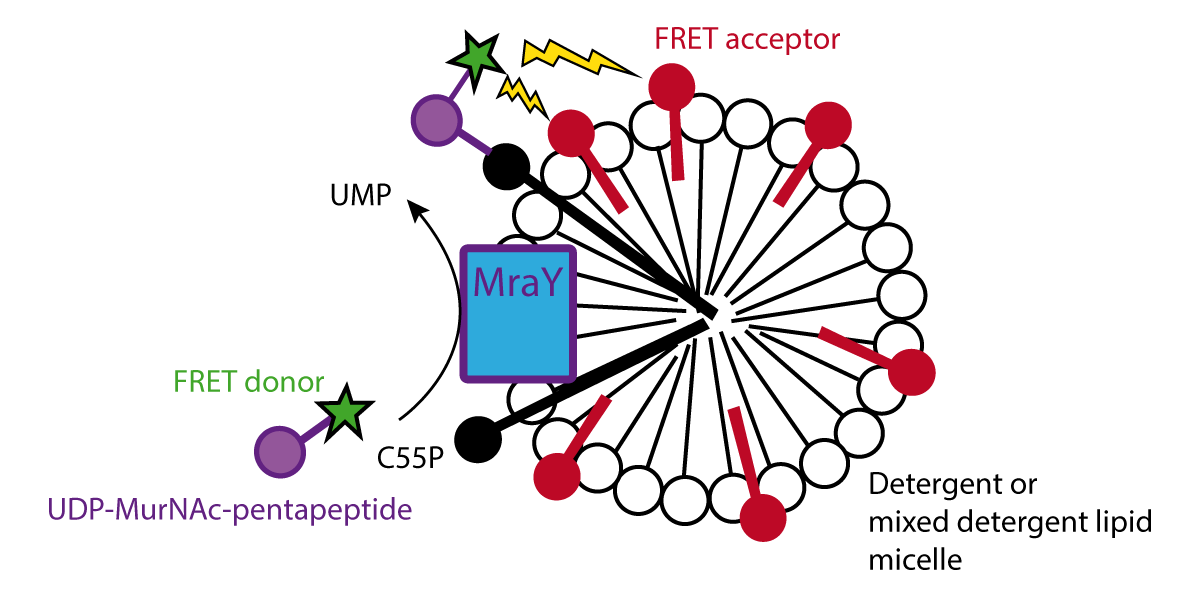
MraY translocase activity will attach B-UNAM-pp to C55P bringing FRET acceptor and donor close to one another. Excitation at 485 nm will result in energy transfer, reducing donor fluorescence (at 520 nm), and increasing acceptor fluorescence (590 nm).
Materials & Methods
- PHERAstar FS microplate reader (BMG LABTECH)
- Optic module (Ex:485 nm; Em: 520/590)
- Chemicals were obtained from commercial sources
- 384 well, low-volume, black, polystyrene plates (Matrix Tech)
Preparation of UNAM-pp and cloning, expression of MraY in E.coli as well as subsequent preparation of membranes from E.coli overexpressing MraY is described in the literature.
A 6 µL mixture containing 0.06% Triton X-100, C55P and E.coli membranes containing MraY was preincubated for 30 min. Addition of 3 mL of B-UNAM-pp +/- UMP initiated the reaction. Reaction buffer consisted of (final concentrations): 50 mM Tris-HCl (pH 7.5), 100 mM KCl, 50 mM MgCl2, 1 mM dithiothreitol and 0.05% Triton X-100. Final concentration of reactants: 20 mM C55P, 50 mg/mL membrane protein, 2 µM B-UNAM-pp with 0-24 µM LRPE and 0 or 5 mM UMP.
Triplicate MraY assays were performed at room temperature. Fluorescence was excited and simultaneous dual-emission measured using 20 flashes for each reading at a focal height 10.6 mm. Measurements were made every minute for 1 hour and triplicate time courses averaged.
To test the effect of storage at room temperature, MraY assay reagents were stored at room temperature in the dark in the presence or absence of 0.5M trehalose. Reagents were mixed after 0, 2.5, and 5 hours of storage at room temperature, and triplicate F590/F520 data were collected at the 1 hour time point. Z’ calculations could then be obtained from samples with (MAX) and without (MIN) membranes.
To study tunicamycin inhibition, reactions contained 16 µM LRPE, 0 or 15 µg/mL MraY-containing E. coli membrane protein, 0.1 µM B-UNAM-pp and 10 µM C55P in assay buffer containing 0.5 M trehalose. Tunicamycin was diluted with assay buffer and average progress curves without membranes were subtracted from the average progresscurves with membranes to obtain D(F590/F520) and DF520 measurements. Percentage inhibition and IC50s were calculated.
Results & Discussion
When the reaction is exposed to fluorescent excitation at 485 nm a time-dependent decrease in 520 and increase in 590 emissions is observed (data not shown). Ratiometric measurements were used as they have less noise than individual fluorescence intensity measurements (Figure 2). This is due to the elimination of fluctuations that equally affect both measurements. The ratio change exhibits an increase in a time and LRPE dependent manner.
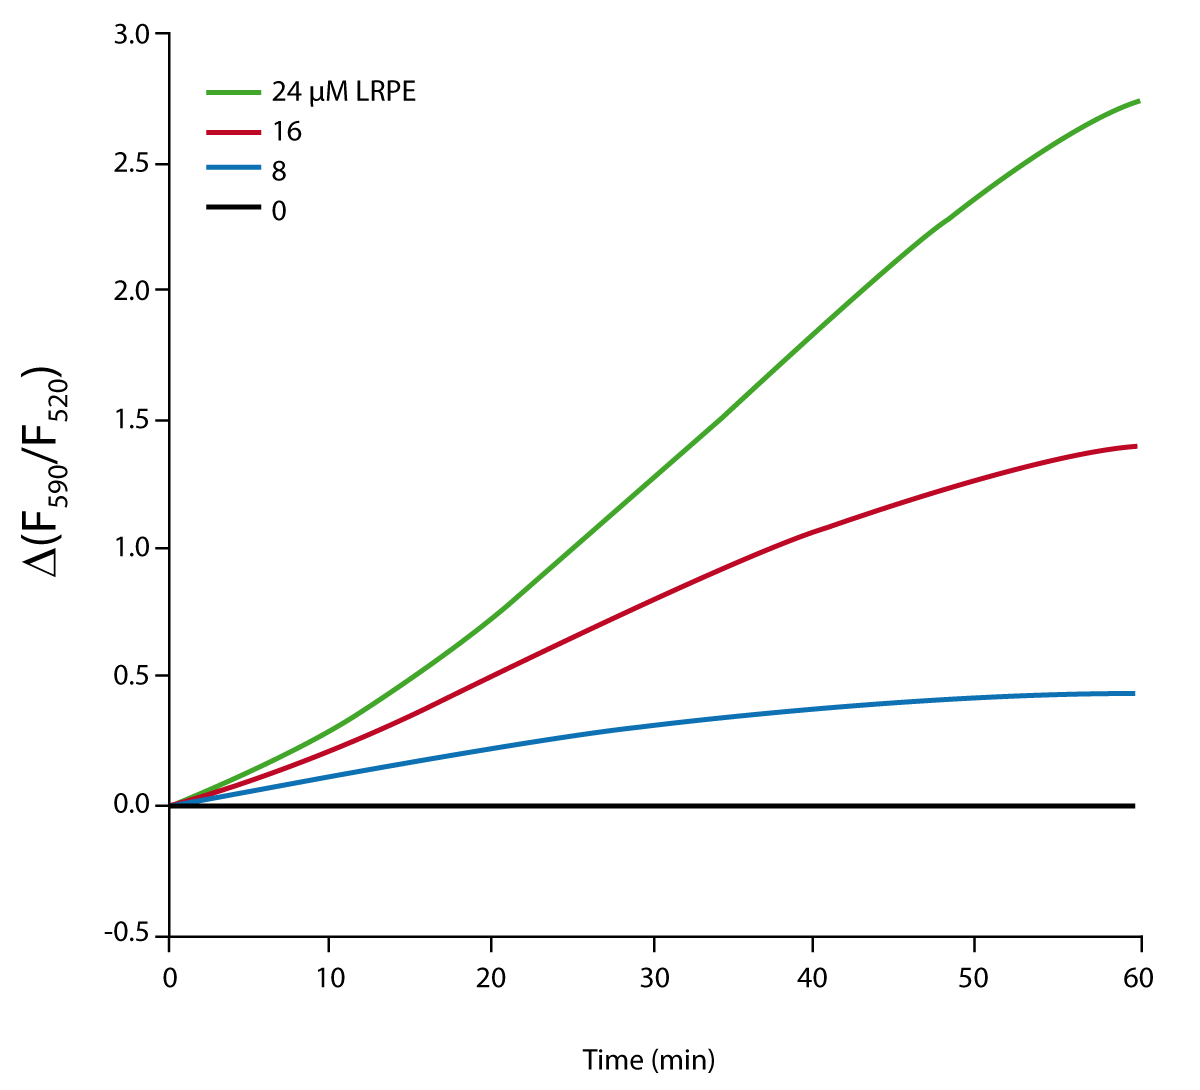
When reactions are performed in presence of 5 mM UMP the change in fluorescence ratio is negligible (data not shown). In the absence of UMP, a large increase in fluorescence ratio is observed with time (Fig. 2). This effect indicates that the signal observed in the assay is due to the MraY reaction.
The effect of trehalose, a sugar stabilizer, on storing the reagents at room temperature was also assessed. Figure 3 shows that Z’ values decrease when assays are stored at room temperature for as little as 2.5 hours. However the addition of 0.5 M trehalose blocks this effect.


The sensitivity of this assay to inhibition was studied using tunicamycin (Figure 4). The results show that IC50s measured using Δ(F590/F520) are lower and exhibited less of an increase with reaction time than those measured with ΔF520.
Conclusion
This assay has several advantages over those previously reported. First: it uses no radioisotopes so no special training, handling, and disposal are required. Second: it uses a donor fluorophore with an excitation wavelength in the visible rather than UV part of the spectrum. This reduces interference from test compound auto-fluorescence and absorption. Finally: a FRET assay using the ratio of the emission of acceptor and donor fluorescence intensities upon donor excitation yields greater precision.
The use of Δ(F590/F520) over ΔF520 is advantageous due to greater sensitivity to inhibition, resistance to loss of sensitivity to inhibition, and a higher signal-to-noise ratio. Furthermore, a Z’ of greater than 0.7 indicates that this approach will be suitable for high throughput screens.