Introduction
Histones are small basic proteins. DNA in a stacked configuration is bound around histones to build chromatin prior the replication procedure. After translation, histone side chains are often modified. This includes acetylation and deacetylation as well as methylation, ADP-ribosylation, and phosphorylation. Histone deacetylation is carried out by enzymes that build a complex with histones. These complexes target specific promoters to repress transcription through deacetylation of histones in specific nucleosomes. HDAC inhibitors (HDACi) have been used to treat neurological symptoms, as well as cancers, parasitic and inflammatory diseases. In order to find compounds that are potential inhibitors of HDAC activity (Class I and II), a chemiluminescent Proof-of-Concept Screen was performed on the PHERAstar FS microplate reader from BMG LABTECH.
Assay Principle
The HDAC-Glo™ I/II assay from Promega measures the activity of HDAC class I and II (Fig. 1). An acetylated peptide is offered as an HDAC substrate. After deacetylation, a protease is added that cleaves the deacetylated substrate and releases aminoluciferin that is immediately consumed by a luciferase. The resulting luminescent signal is proportional to the HDAC activity.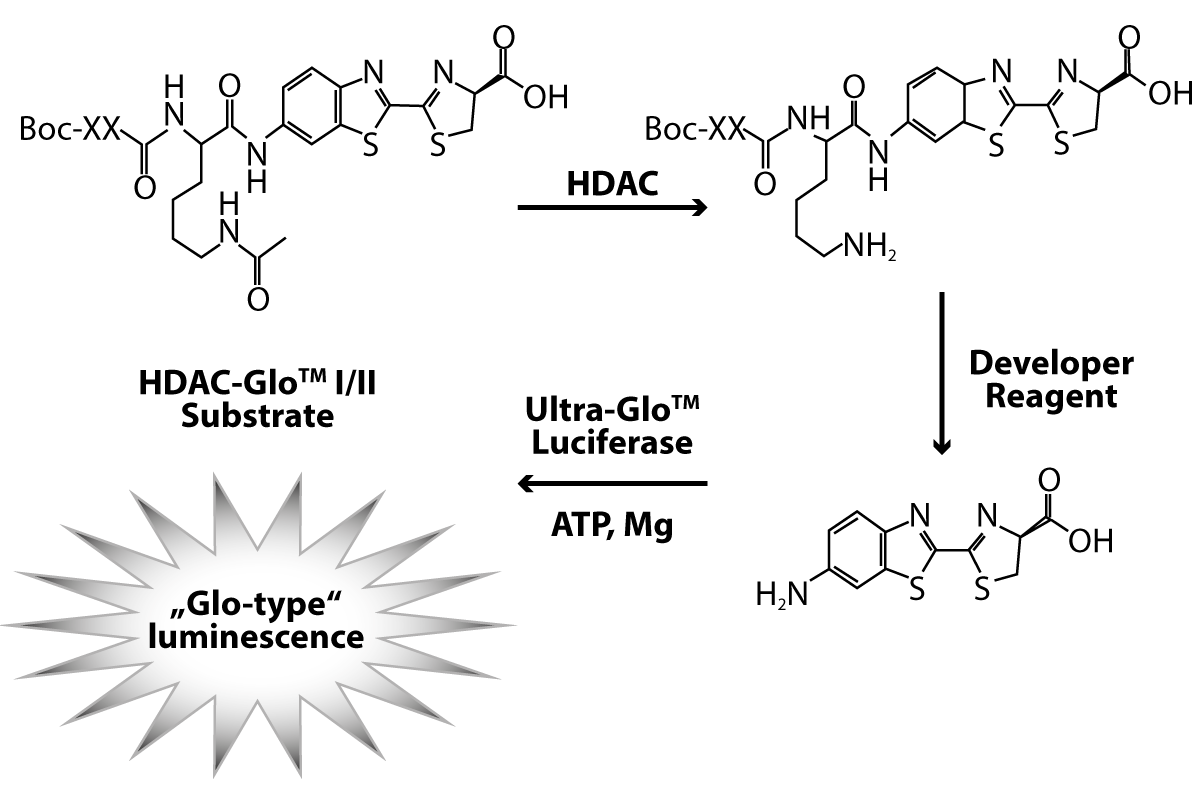
Materials & Methods
- HDAC-Glo I/II from Promega
- white 384 well plates, small volume, non-binding
- Echo liquid handling system from Labcyte
- PHERAstar FS microplate reader from BMG LABTECH
Dose response curve of a standard inhibitor
Dissolve the inhibitor in DMSO and prepare a dilution series in DMSO in a Labcyte plate. Transfer the inhibitor to an assay plate using the Labcyte Echo. Dilute enzyme to the desired concentration (2x final concentration) in assay buffer. Dilute developer solution 1:1000 in substrate solution. Add 5 μl of enzyme to each well of the plate and seal. Centrifuge plate 1 min. Add 5 μl of developer reagent to each well. Seal assay plate. Centrifuge the plate 1 min. Shake plate on a plate shaker for 30 seconds. Incubate plate at room temperature for 10 min. Detect the luminescence signal on the PHERAstar FS.
Proof-of-Concept Screen and Counter Screen
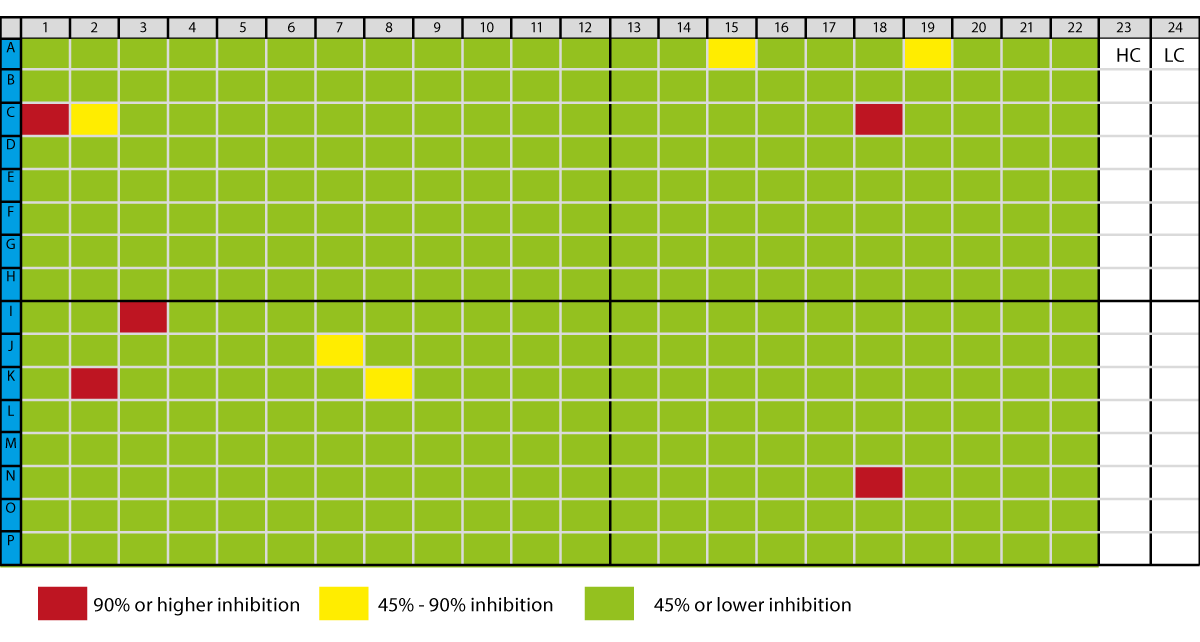
50 nl of compounds from the library are added with the Labcyte Echo liquid handling system. Add 5 μl of enzyme, seal, and centrifuge. Then add 5 μl of reagent, seal, centrifuge, and shake the plate as described above. After an incubation of 10 min, the plate is read in the PHERAstar FS. To identify false positives, a Counter Screen was performed using a control substrate which contains deacetylated substrate. This control substrate is diluted 1:10,000 in assay buffer. The to be tested compounds are transferred to an assay plate using the Labcyte Echo and 5 μl of control substrate added to each well. Centrifuge plate for 1 min and shake for 30 seconds. No enzyme should be added. Add 5 μl of reagent, seal, centrifuge, and shake the plate as described above. After an incubation of 10 min, the plate should be read in the PHERAstar FS.
PHERAstar FS instrument settings
| Measurement type: | Luminescence |
| Measurement mode: | Endpoint |
| Optic module: |
LUM plus module
|
| Gain: |
3600
|
|
Measurement time: |
1.0 seconds (0.2 seconds for Proof-of-Concept Screen and Counter Screen)
|
Results & Discussion
An enzyme titration was performed in order to find a useful enzyme concentration for screening. The enzyme titration measurement was started immediately after addition of developer reagent and data points were collected every 2 min for 46 min. After 20 min a plateau was reached (data not shown). Based on these findings all further microplates were prepared using 5 nM of enzyme and incubated for 10 min at room temperature before the measurement started.
Dose-response curve of a standard inhibitor
To test the assay for a standard inhibitor, different concentrations of inhibitor were prepared and measured. The results can be seen in Fig. 2.
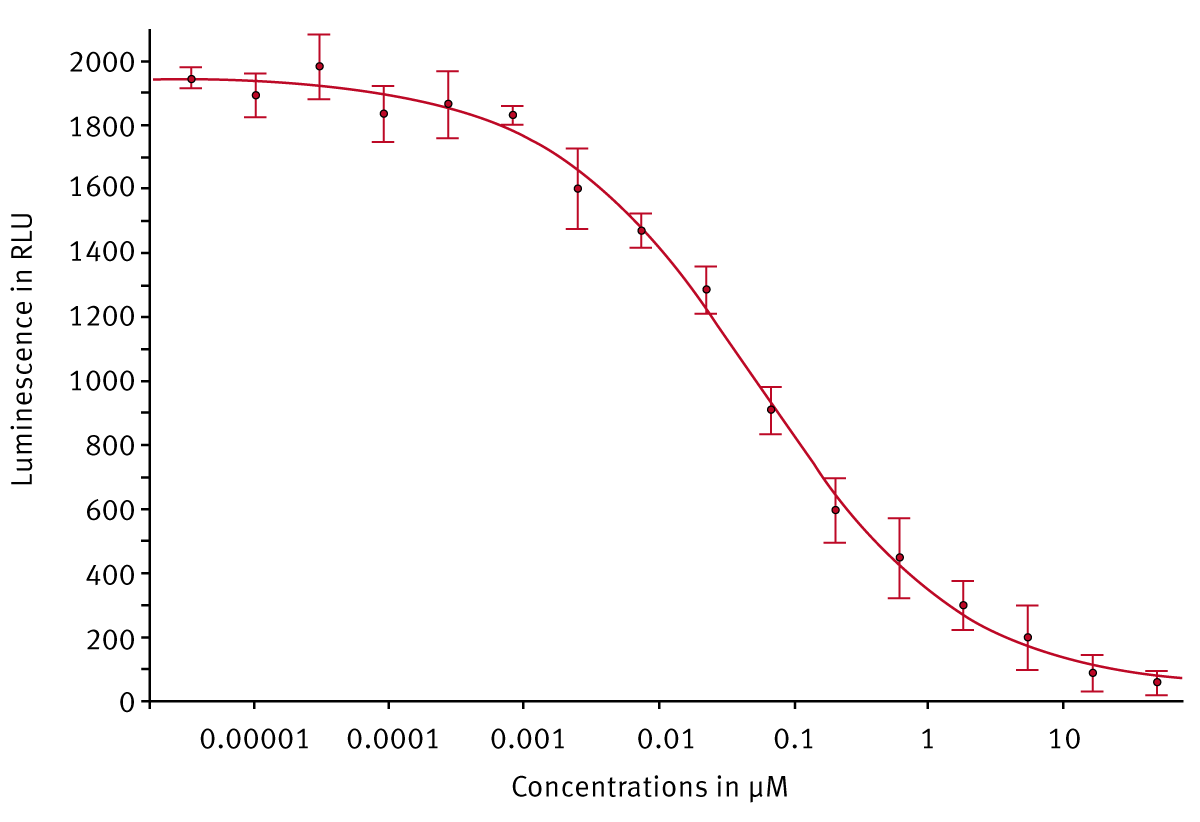
A 4-parameter fit was applied in the MARS software. The resulting IC50 value was 55 nM and agreed with our experience for that standard inhibitor.
Proof-of-Concept Screen and Counter Screen
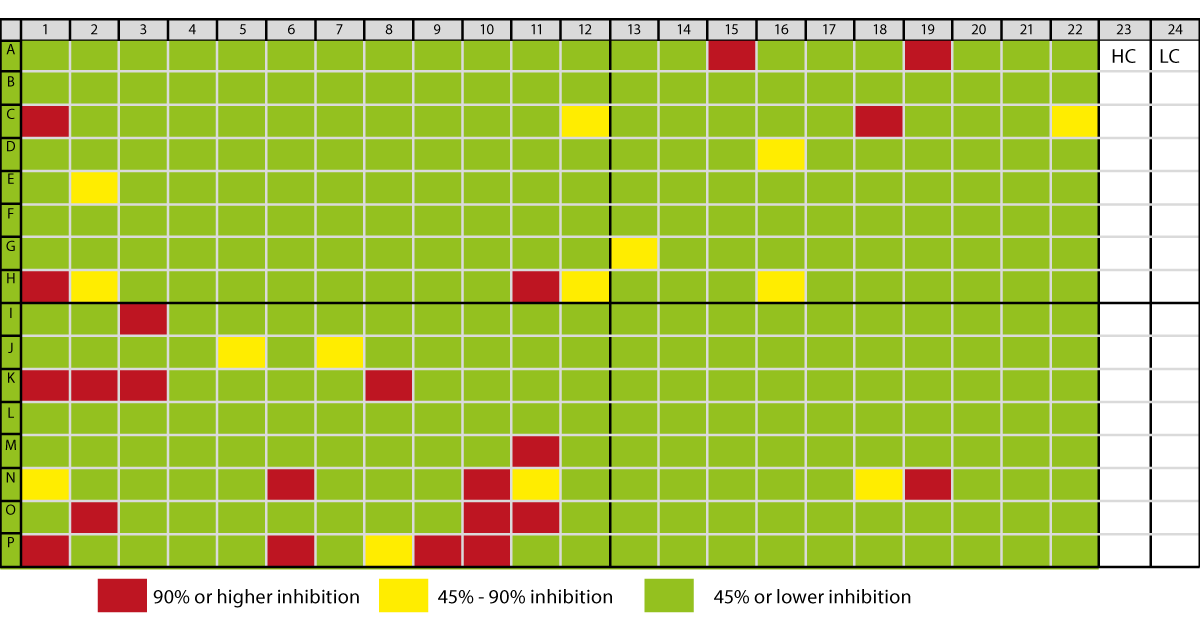
A subset of the LOPAC library was screened for active compounds against HDAC. The screening results in the plate were visualized by setting limits in the MARS software. The results can be seen in Fig. 3.
 Active compounds against HDAC will inhibit HDAC activity. The evaluation of the data is done with the MARS Data Analysis Software and based on the % inhibition calculation using the following formula:

Most promising Hits are defined to show 90 % or higher inhibition (red marked wells in figure 3).
A few Hits were found during the compound screen. Some of them showed also up in the Counter Screen, indicating false negatives that are either active against the protease in the developer solution or against the luciferase. This shows that Counter Screens are very useful especially if the assay includes a coupled enzyme system to detect target activity.
Conclusion
This application note shows that the PHERAstar FS can be used for screening assays as well as for assay development. The data is obtained quickly and reliably. Hits can be identified even during the measurement using the current state option. Data processing and color gradient microplate views can be easily adapted using the MARS Data Analysis software.