SPECTROstar Nano
Absorbance plate reader with cuvette port


Oliver Carney is the UK Applications Manager at BMG LABTECH, where he leads a team supporting academic, biotech, and pharmaceutical customers in achieving high‑quality results with microplate reader technologies. Based in the West Midlands, he has been with BMG LABTECH since 2014, progressing through roles including Applications Specialist, Senior Applications Specialist, and Distributor Manager for Northern Ireland. His background in forensic and biological sciences, combined with extensive field experience, shapes his hands‑on, customer‑focused approach to scientific applications support.
To quantify relative potency, the substances being compared are typically assayed across a range of concentrations at which the effect of the compound is quantified (a dose-response assay). There are a wide range of assays that allow the quantification of the effect of a compound, and the most appropriate option often depends of the characteristics and action of the compound itself. This measurement can include quantifying the extent of binding of a ligand to a receptor, the downstream intra-cellular response, or a change in the level of gene expression. Microplate readers such as those from BMG LABTECH provide a flexible platform on which to achieve high throughput measurement of many of these assay techniques.
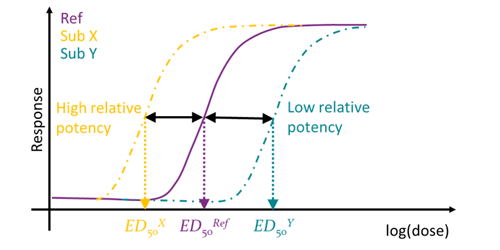
The results of these dose-response assays can be plotted as a graph of concentration (x) against response (y) and a curve of best fit (often a 4- or 5- parameter fit) is applied. In such assays low concentrations of drug or agent do not illicit a response and high concentrations the response is saturated such as to provide no further change, while at concentrations between these low and high values the dose response is relatively linear. From these curves the concentration at which 50% of the response is observed can be determined. This is known as the EC50 or IC50 value, and can be used to compare the effectiveness of a compound. Many software packages, including the MARS data analysis software included with BMG LABTECH microplate readers, are capable of fitting curves to data and providing an EC50 value.
EC50 values do not however take into account other characteristics of the dose-response curve, such as the gradient or the top and bottom values of the slope – the point at which no or very little effect is seen and the point at which the response to the compound saturates. These characteristics may be of importance when considering the use of a compound, for example a potential drug.
A more robust comparison is performed using Parallel Line Analysis (PLA). This requires the response curves to have similar asymptotes and the linear regions of the curve to be close to parallel, this by its nature a more complicated calculation but provides more accurate and complete information.
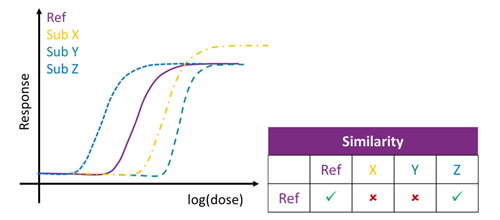

In measuring relative potency, it is often important that other characteristics do not change – if the curves are not parallel the relative potency will vary with dose and it is difficult to determine an appropriate value. It is important therefore that parallelism is confirmed as part of this comparison. This is often where it is helpful to employ a software package such as MARS that can provide a statistical output of parallelism.
Parallel Line Analysis compares a test compound or compounds against a standard compound. Different models can be employed to determine parallelism. The European Pharmacopeia guidelines recommend the difference testing approach (Council of Europe 2011), in which the standard and test curves being compared are fit to the data using shared parameters, and also using independent parameters. The difference between these curves is statistically determined through analysis of variance (ANOVA) and if considered to be statistically insignificant then the curves are said to be parallel.
An alternative method, known as equivalence testing, is recommend by The United States Pharmacopeia bioassay guidelines (The United States Pharmacopeial Convention 2012a, 2012b, 2012c). Here, both curves are fit independently and the fit parameters themselves are compared. The ratios of the fit parameters are said to be equivalent if they fall within the defined equivalence limits.
Both models are available in MARS, and users are free to choose their preferred approach. In application note AN332: Assessing parallelism using Parallel Line Analysis (PLA) in MARS, Mario Schneider from BMG provides a step-by-step explanation of the options in the software using a worked example.
Once it is established that the curves are parallel, relative potency is a straightforward ratio calculation of the EC50 values.
This method allows researchers to statistically confirm and compare compound potency. Software packages that include a PLA function, such as MARS, can take the analysis burden off the user, and ensure that an auditable record is maintained. BMG LABTECH’s MARS software is fully GxP compliant meaning that it includes all the functionality required conform to FDA CFR Part 21 and MHRA requirements. Combined with the high-throughput potential of microplate reader technology, large compound libraries can be screened and compared to enhance the process of drug discovery.
Absorbance plate reader with cuvette port
Powerful and most sensitive HTS plate reader
Most flexible Plate Reader for Assay Development
Upgradeable single and multi-mode microplate reader series
Flexible microplate reader with simplified workflows