Introduction
Cells are transfected with exogenous DNA to study the regulation of gene and protein expression. To monitor transfection efficiency, a reporter gene is often attached to the gene of interest to monitor its insertion into the cell’s genome. Fluorescent proteins like Green Fluorescent Protein (GFP) are often used as such reporters during transfection efficiency experiments. The reporter gene can either be present on the same vector as the gene of interest or can alternatively be located on a separate plasmid. The success of a transfection experiment is defined by the ratio of cells expressing the used reporter which “reports” on the insertion of the gene of interest. This ratio is also known as transfection efficiency.
Assay Principle
If cells are stably transfected with the genetic blueprint for fluorescent proteins, they will consistently express these reporters. Thereupon, a fluorescence microscope or a fluorescence microplate reader can be used to detect them. By mixing fluorescent with wild type (WT) cells, transfection efficiency can be simulated to different extents (fig.1). Here, HeLa cells were transfected with the genetic sequences for GFP and mcherry and mixed in increasing ratios with WT-HeLas without fluorescent reporter to simulate transfection efficiency.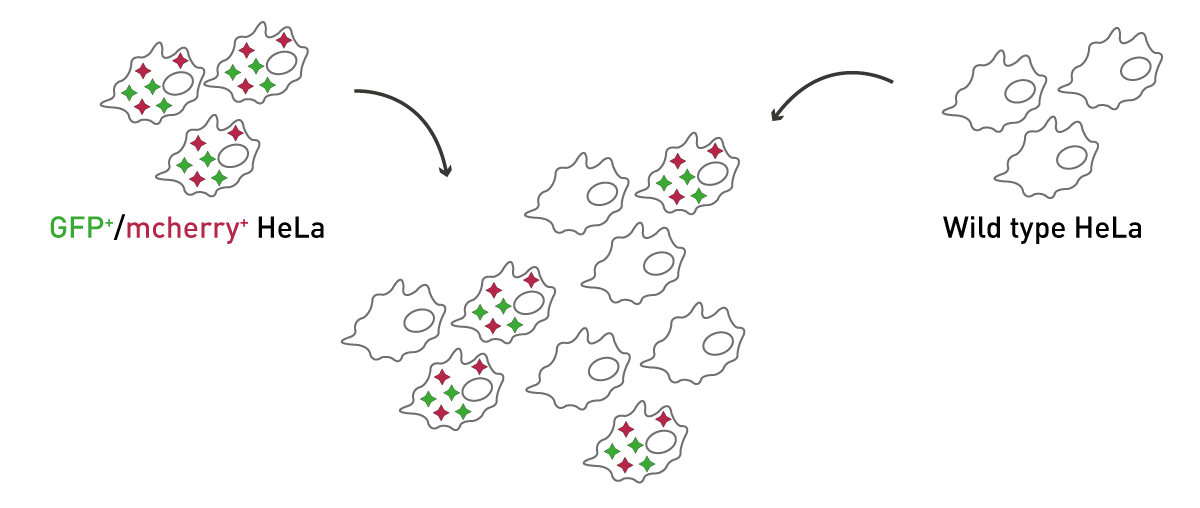
Materials & Methods
- 96-well plate, black, µclear bottom, TC-treated (#655866, Greiner)
- WT-HeLa cell line OR stably expressing GFP+/mcherry+-HeLas
- DMEM with 10% FBS, 2 mM glutamine and 1% pen/strep (all Thermo Fisher)
- FluoroBriteTM DMEM (#A1896701, Thermo Fisher)
- Hoechst 33342 (#H3570, Thermo Fisher)
- Paraformaldehyd 4% (PFA, #J61899, Thermo Fisher)
- Phosphate buffered saline (PBS, #D8537, Sigma Aldrich)
- Incubator with 37°C, 5% CO2 and humidity control
- VANTAstar® microplate reader
Experimental Procedure
Cell culture:
GFP+/mcherry+- and WT-HeLa cells were precultured separately in tissue culture flasks in DMEM with 10% FBS, 2 mM glutamine and 1% pen/strep. On the day before the measurement, cells were detached and seeded with 20,000 cells/well on a 96-well plate with µclear bottom in 200 µL medium. GFP+/mcherry+-HeLas were seeded in ratios from 0%-100% by mixing them with WT-HeLa cells to simulate transfection efficiency to different extents. Cells were allowed to attach to the cell culture surface overnight.
Measurement:
On the day of measurement, the cell supernatant was discarded, and the cells were washed 2 x for 5 min in 200 µL FluroBrite medium with 5% FBS, 2 mM glutamine and 1% pen/strep. Plates including 200 µL medium/well were transferred to the VANTAstar plate reader and GFP and mcherry fluorescence was determined either with matrix scan or spiral averaging using the bottom optic setting to evaluate the simulated transfection efficiency. Afterwards cells were fixated in 4% PFA and stained with Hoechst 33342 for 15 min, washed 3 times in PBS, and read again with the VANTAstar using matrix scan or spiral averaging. With the measurement of the Hoechst signal, total cell counts were determined as internal standard for the evaluation of the transfection efficiency.
Instrument settings
| Optic settings |
Fluorescence intensity, endpoint | |
| Monochromator, bottom optic | ||
| Hoechst 33342 | Ex: 355-20 Em: 455-30 |
|
| GFP | Ex: 470-15 Em: 515-20 |
|
| mcherry | Ex: 570-15 Em: 620-20 |
|
| General settings |
Settling time | 0.1 s |
| Scan settings |
Scan diameter | 6 mm |
| Matrix scan | 15 x 15 (1 flash/point) | |
| Start settings |
Start settings |
Adjusted focal height
|
|
50% of highest standard
|
||
Results & Discussion
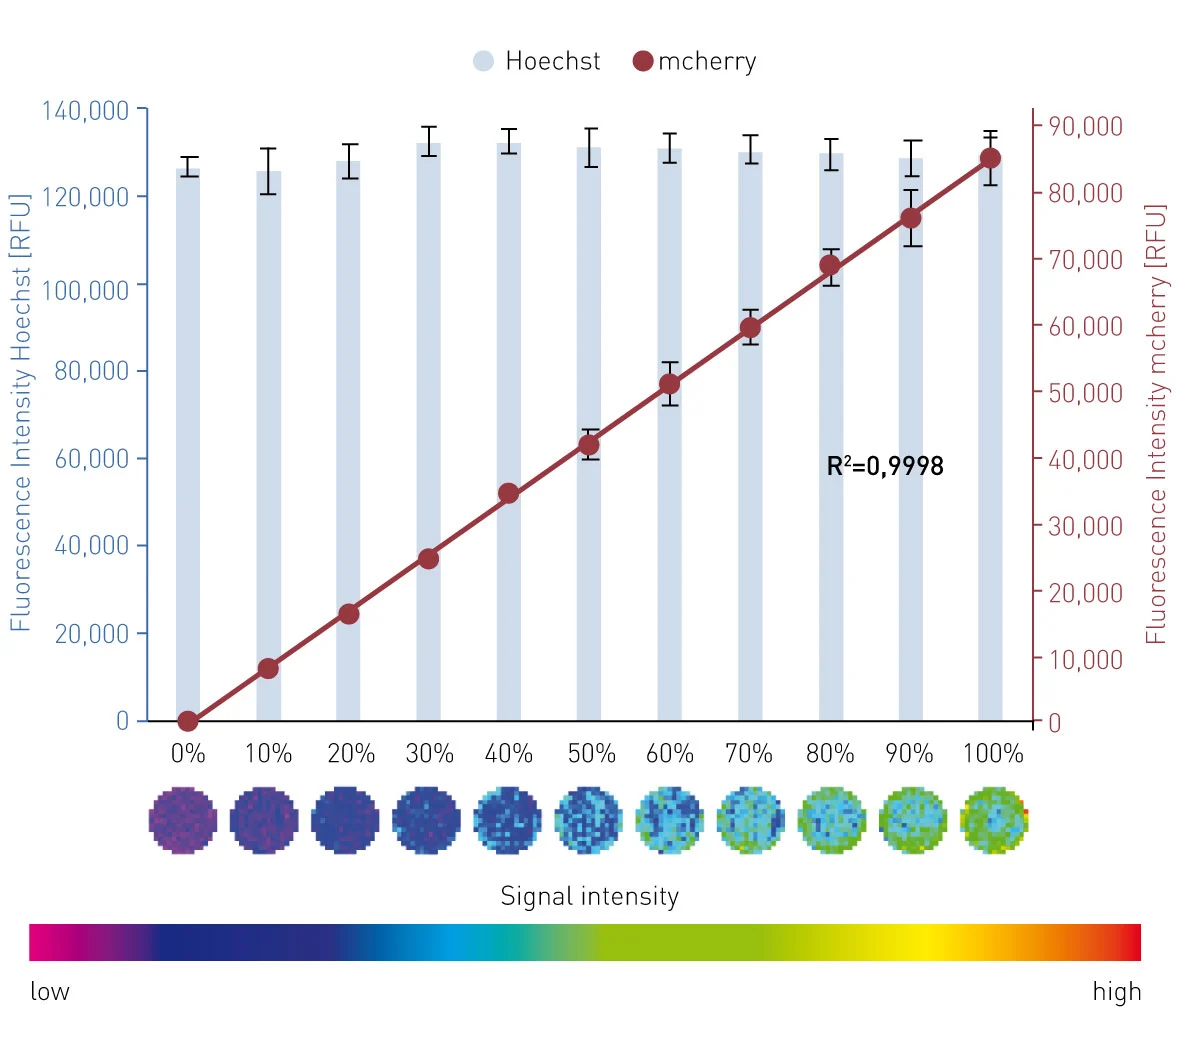
The results in fig. 2 and 3 confirm a linear relationship between the percentage of GFP+/mcherry+ HeLas (= transfection efficiency) and the measured signal for GFP or mcherry fluorescence with high accuracy (R² = 0,9997 and 0,9998) and precision (%CV = 10.5 and 5.2).
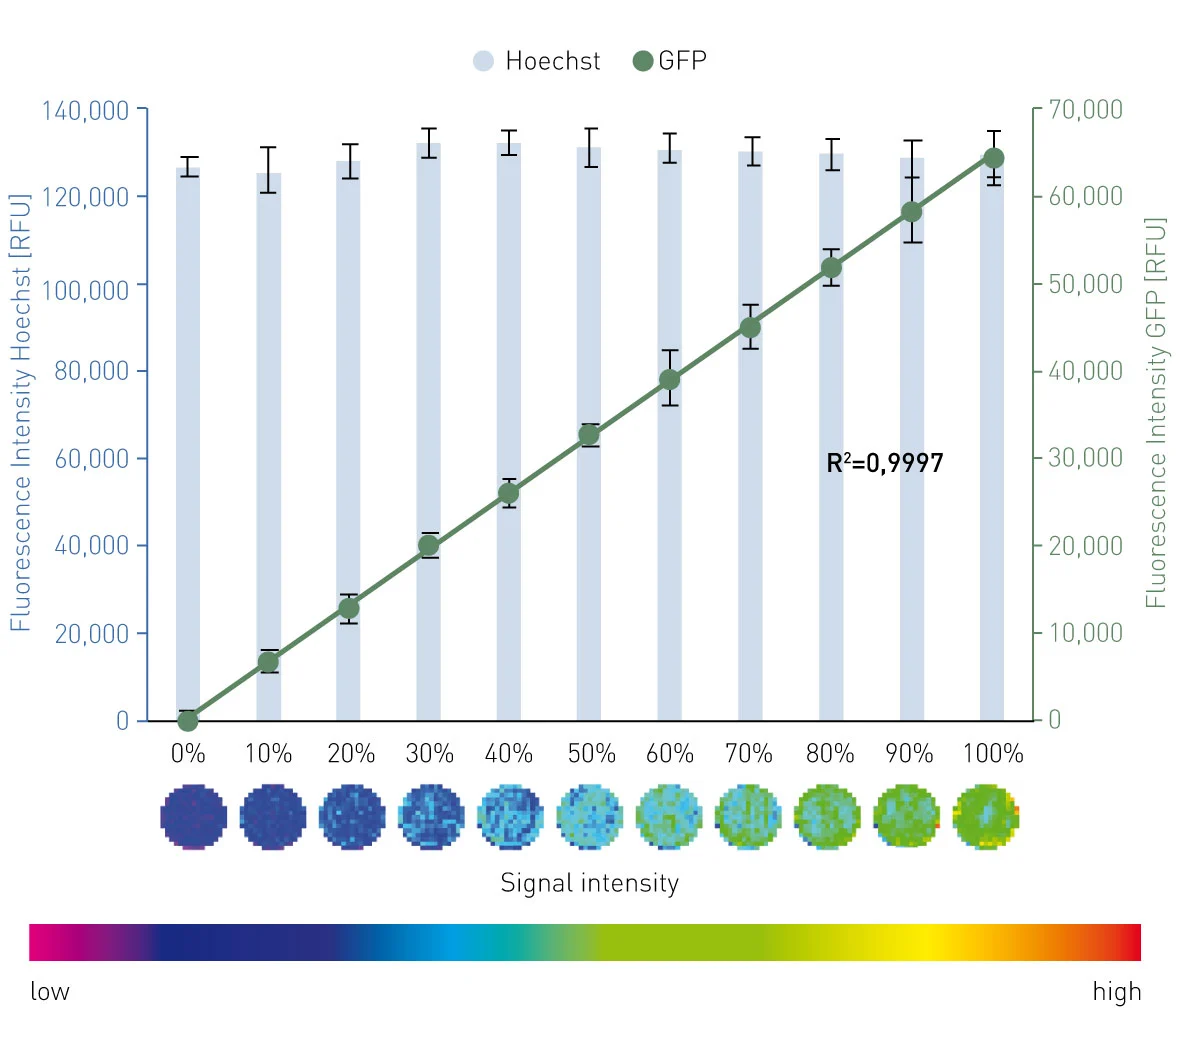
Matrix scans provide a local resolution of the signal throughout the well and thereby provide the opportunity to monitor seeding homogeneity and local variations of the transfection efficiency. In this measurement, 225 single measurement points were available, providing an image-like insight into the well and the level of transfection efficiency. Furthermore, this scan option allows exclusion of single measurement points as outliers. The spiral averaging measurement setting does not provide this resolution. However, it requires a fraction of the time (4 min spiral averaging vs. 34 min matrix scan per full 96-well plate) and provides data of comparable quality.
The lower limit of detection for the simulated transfection efficiency in 20,000 cells per well was calculated based on the SD of the blank (= 100% WT HeLa w/o GFP+/mcherry+-HeLas) and the slope of the respective standard curve. The VANTAstar is able to reliably detect a transfection efficiency down to 5.3% measuring GFP fluorescence (fig. 4). The detectable transfection efficiency could be improved even further down to 3.1% by measuring mcherry fluorescence. This benefit can be mainly attributed to the reduced presence of cellular autofluorescence as well as of autofluorescing cell culture medium components in the red wavelength range.

Conclusion
BMG LABTECH plate readers reliably detect cells expressing a fluorescent marker down to ~600 cells/well in a 96-well plate and thereby represent a valuable alternative to microscopes to monitor transfection efficiency. Both matrix scan and spiral averaging deliver accurate results, allowing the user to choose between speed and image-like resolution. The readers also reliably detect transfection efficiency experiments based on red-shifted dyes. These come with the advantage of avoiding most of the autofluorescence derived primarily from media and cell-derived components.