Introduction
The Seahorse Xfe96 analyser measures cell metabolism by monitoring oxygen consumption and extracellular acidification in 96 well plates. Cell numbers in wells can differ due to pipetting errors and differing growth rates, which influence the oxygen consumption rate (OCR) and extracellular acidification rate (ECAR). Normalisation is required to confirm that the differences in metabolic profiles between wells are not falsely indicated by a difference in cell numbers but due to actual cell characteristics or experimental conditions.
BMG LABTECH’s CLARIOstar® Plus microplate reader measures the fluorescence of Hoechst-stained cells and prepares the data to be imported into the Seahorse “Wave” software for normalisation. This method of normalisation is a fast, reliable, and cost-effective alternative to microscopy-based normalisation, requiring expensive instrumentation.
Assay Principle
The Hoechst stain is added to the final reagent of the Seahorse assay before injection. The cells in the well are stained during the final step of the assay. Once the cells are stained, the plate is removed from the Seahorse and placed in the CLARIOstar Plus. A well scan of 15x15 over 3 mm was measured to cover the Seahorse well (A). B shows a typical well scan of the area. The signal to blank ratio is calculated in the BMG LABTECH MARS analysis software. Automatically exported Excel data are imported into the Seahorse software via simple “copy and paste”- function to visualise the normalised data (C).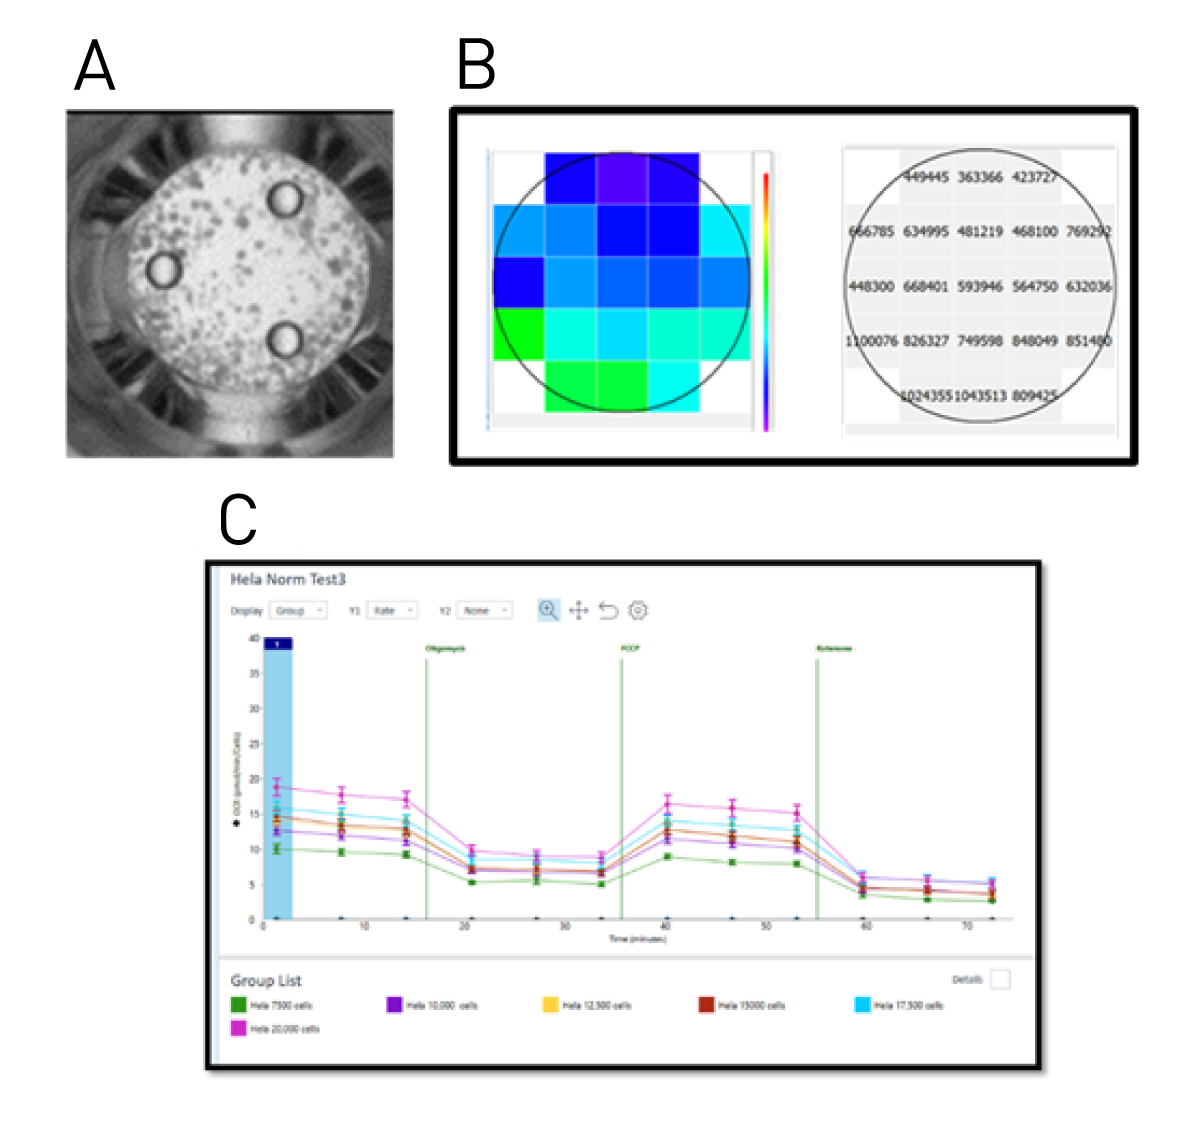
Materials & Methods
- Seahorse xfe96 analyser
- Seahorse 96 well plate
- BMG LABTECH CLARIOstar® Plus
- Tocris Hoechst 33342 Stain (Cat no 5117)
Experimental procedure
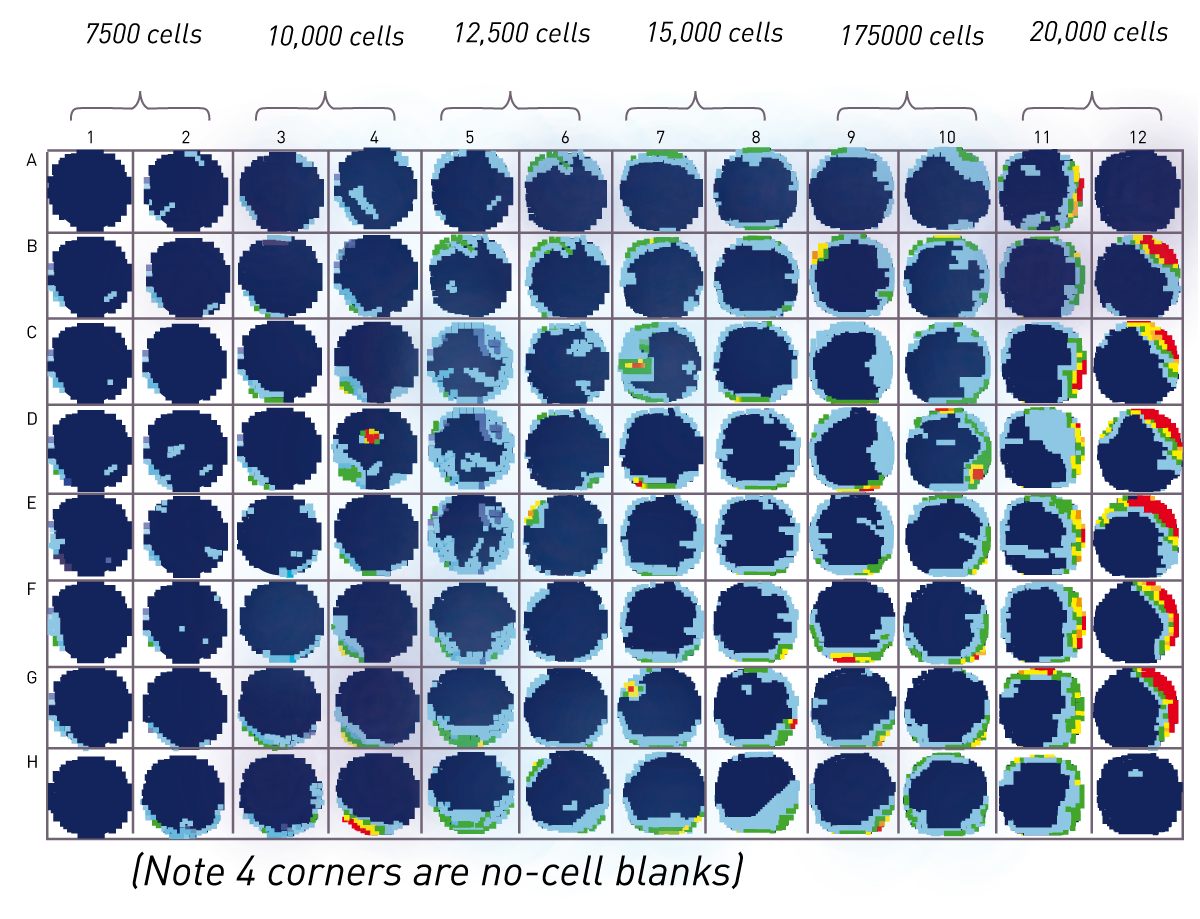
For the proof of concept experiments, HeLa cells (titrated from 7,500 to 20,000 cells) were seeded in replicates of 16 into a Seahorse 96 well plate. The four corner wells without cells served as blanks (Fig.2 (A)). The Hoechst dye (25 mM) was mixed 1:1000 with the last solution added to the cell plate during a Seahorse analysis to achieve a final Hoechst concentration of 2.5 µM per well. For the MitoStress test, solution C (a mixture of rotenone and antimycin) was supplemented with Hoechst as it is the last reagent added to cells. Staining cells during the last stage of the Seahorse run ensures no effect on the assay itself. Due to automatic dye addition, the cell plate was ready directly after Seahorse analysis to be read by the CLARIOstar Plus. A well scan matrix of 15x15 points per well (Fig 1. (D)) was acquired to measure cells throughout the well and compensate for non-homogenous cell distribution. The average signal of a well was divided by the averaged blank using the MARS analysis software to give signal/blank ratio. This ratio can then be exported into excel, and imported into the Seahorse software via a simple “copy and paste” function. The Seahorse software will apply the imported numbers to the analysis and normalise the data automatically.
Instrument Settings
| Optic settings |
Fluorescence intensity, endpoint - Top read |
|
| Monochromator settings | Hoechst pre-set Ex 355-20 Em455-30 |
|
| Gain and focus |
1400 / 2.1 mm | |
| General settings | Number of flashes | 2 |
| Settling time | 0 s |
|
| Well scan | Matrix scan | 15 x15 (3mm) |
| Incubation | 37° C |
|
Results & Discussion
Comparison of fluorescent and microscopic cell quantification
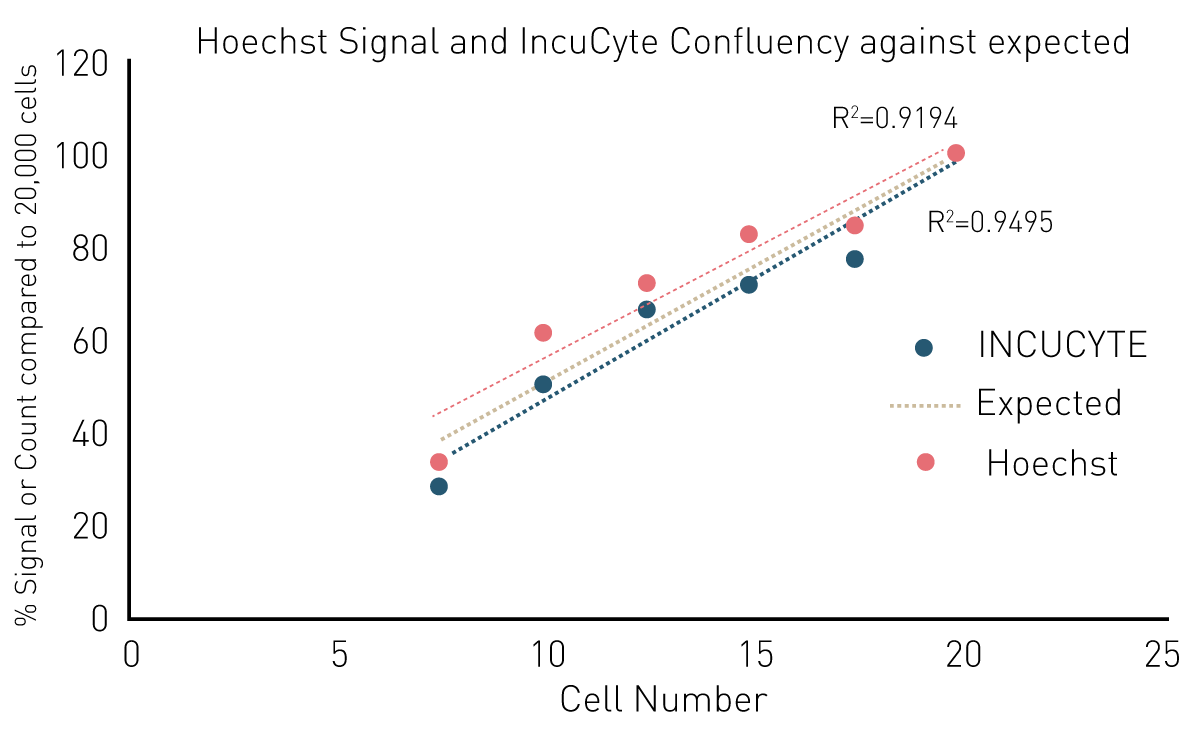
Initial experiments compared the cell measurement using Hoechst and CLARIOstar Plus with microscopic cell counting using an IncuCyte. Both methods quantified cells seeded at different densities and each signal was related to the maximum signal at 20,000 cells per well. Plotting the average of 16 replicates of both methods against the seeding cell number shows a good correlation of methods. Although the curves are not perfectly linear, the agreement of the two curves suggests that the cell quantification methods are comparable (Fig. 2(B)).
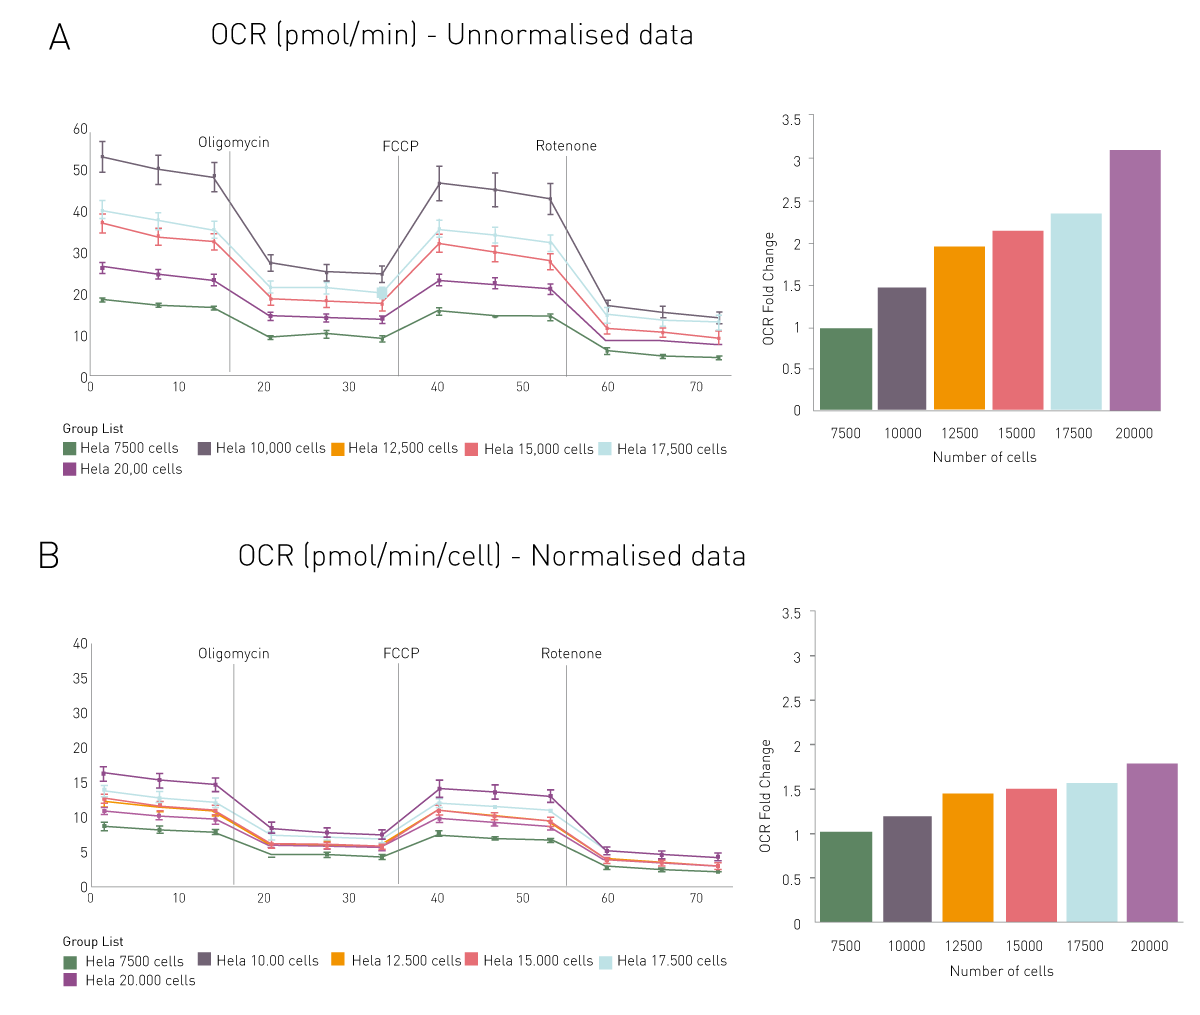
The signal to blank ratio is calculated from CLARIOstar Plus fluorescence intensity measurements of wells with and without cells. The data is transferred to the Seahorse “Wave” software by “copy and paste”. Oxygen consumption rates without normalisation and with Hoechst-based normalisation are shown in Fig. 3. To compare normalised with raw values, fold changes were calculated with the OCR determined at lowest density being 1 (Fig. 3). Unnormalised OCRs acquired for 20,000 cells were 3.11 times higher than for 7,500 cells, while the normalised OCR was only 1.77 times higher. The results shown are for OCR but normalisation on ECAR can also be achieved using this method.
Conclusion
The CLARIOstar Plus offers an easy, quick, and cost-effective option to normalise cell numbers in Seahorse Xfe96 metabolic assays following completion of the run. Thus, replacing the need for expensive microscopic devices. A simple addition of Hoechst dye to the final reagent of the Seahorse assay labels the cells to be read by a fluorescent well-scan protocol on the CLARIOstar Plus immediately after the Seahorse run has completed. This labelling method produces a signal that is proportional to the number of cells present within the range tested here. Data can be automatically calculated and exported using a calculation template attached to the read protocol and can then be easily imported into the Seahorse “Wave” software to normalise results.
NB
- Seahorse assays require a number of cells that ensure they maintain a healthy metabolism
- Normalising across a wide range may introduce metabolic effects. Aim for a consistent number of cells for each well.
- Normalisation is not a “cure all”: always optimise conditions and do not seed the cells too sparsely or too confluently.