Introduction
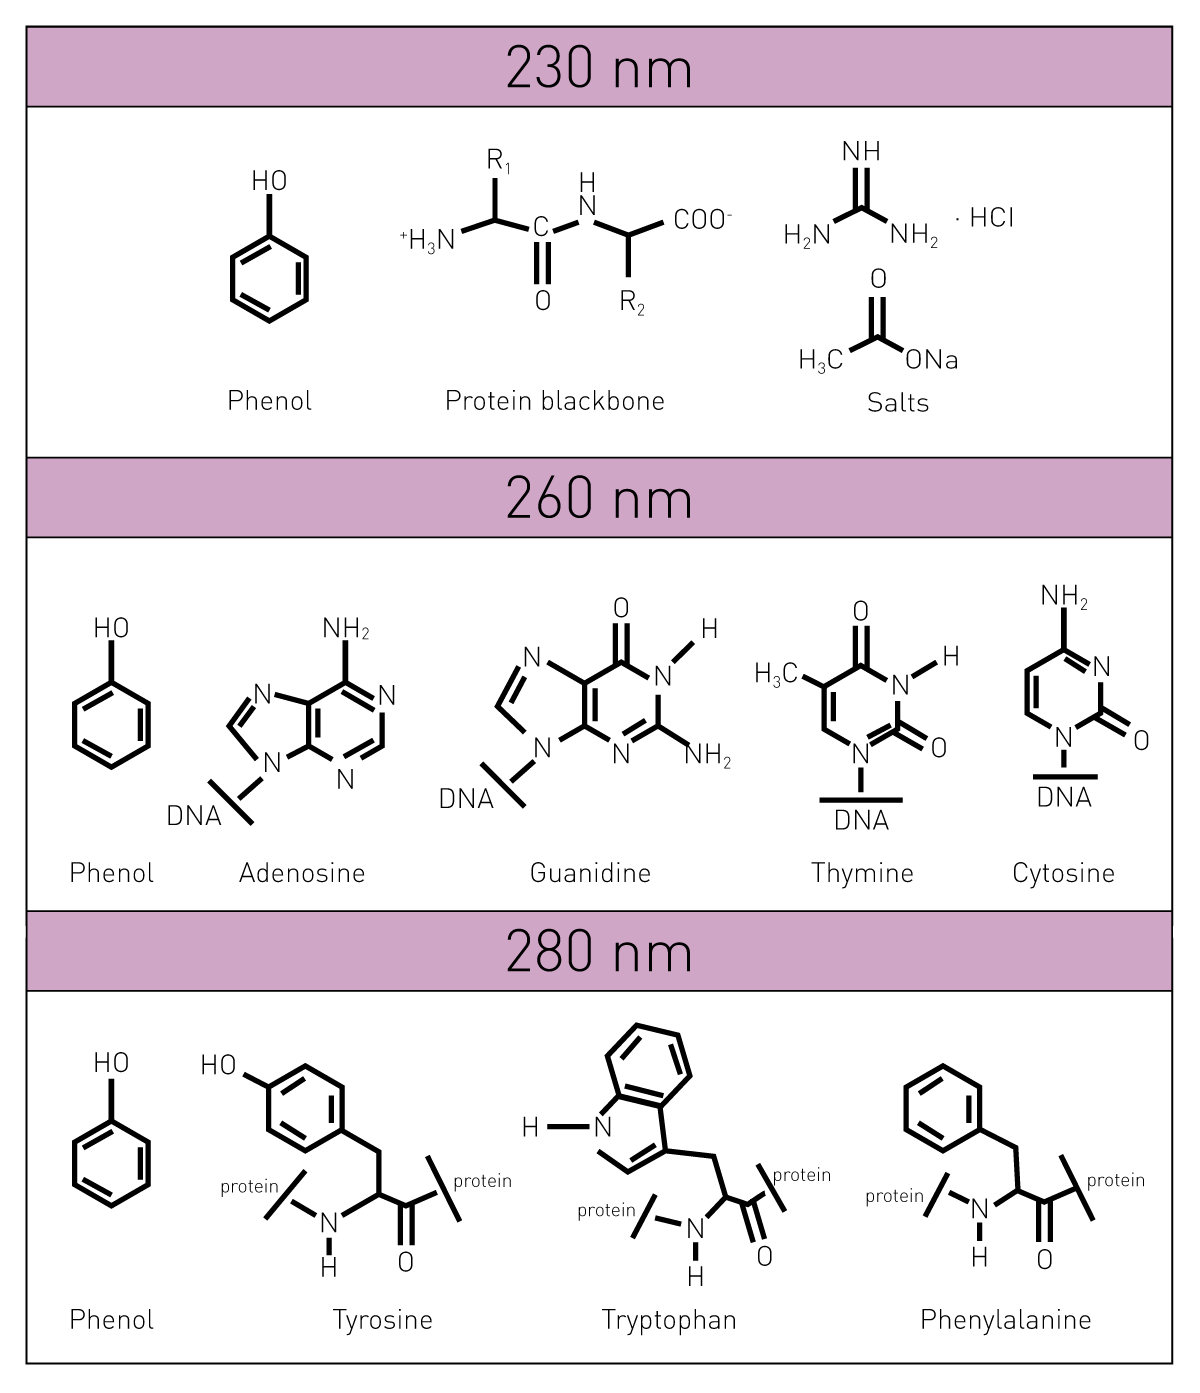
The quantification of nucleic acids (DNA and RNA) is a central step in molecular biology as downstream experiments rely on the use of adequate amounts. Next to the quantification of nucleic acids, the determination of the DNA purity ratio is crucial since impurities may affect the successful implementation of subsequent evaluations. Such impurities can be derived from various sources. Contaminants like cell-derived proteins, chemicals from purification processes (e.g., phenol), or particulate components of the consumables (e.g., cellulose from purification columns) are regularly found in DNA extracts. Such impurities can be uncovered by scanning the sample absorbance at 230, 260, 280, and 340 nm, respectively, where DNA displays a distinct spectrum curve. Potential contaminants influence the absorbance at these wavelengths (Table 1). Thereby they alter the curve and can be used to assess sample quality by calculating the DNA purity ratios 260/280 and 260/230 nm.
Materials & Methods
- UV/vis spectrometer-based BMG LABTECH reader and LVis Plate
- dsDNA from calf thymus 1mg/mL (#D4522), Merck guanidine hydrochloride (#G7294), sodium acetate (#S2889), all Sigma Aldrich
- phenol (#0038.1), H2O (#A511.1), TE buffer 100x (#1052.1), all Carl Roth
- BSA (#60-00020-10), PluriSelect
Experimental Procedure
dsDNA was prediluted to 500 µg/mL in 1x TE buffer. Subsequently, the dsDNA was further diluted 1:1 to a final concentration of 250 µg/mL either with deionized water in the case of pure DNA or the preparations containing impurities. Final concentrations were: guanidine hydrochloride (guanidine HCL, 0.4M), sodium acetate (0.4M), bovine serum albumin (BSA, 0.2%), phenol (0.05%), and starch (0.1%). 2 µL of each DNA mixture were transferred into an LVis Plate in quadruplicates. Afterward, plates were read with the UV/vis spectrometer. The spectrometer measures full absorbance spectra in <1 s/well.
Instrument settings
| Optic settings | Absorbance, endpoint | |
| Spectrum 1 nm resolution | 220-1000 nm | |
| General settings | Number of flashes | 100 |
| Settling time | 0.3 s | |
Spectra were smoothed with a box car width of 5. DNA quality was evaluated based on the DNA purity ratio 260/280 and the DNA purity ratio 260/230 with the BMG LABTECH MARS data analysis software.
Results & Discussion
Absorbance-based BMG LABTECH multi-mode microplate readers acquire absorbance spectra using an ultrafast UV/vis spectrometer.
Spectra of potential contaminants
Salts like guanidine HCL or sodium acetate don’t seem to interfere with the measurement at 260 nm or 280 nm, however, absorb below 240 nm (figure 1). Phenol shows a similar behavior and has an additional peak at 270 nm.
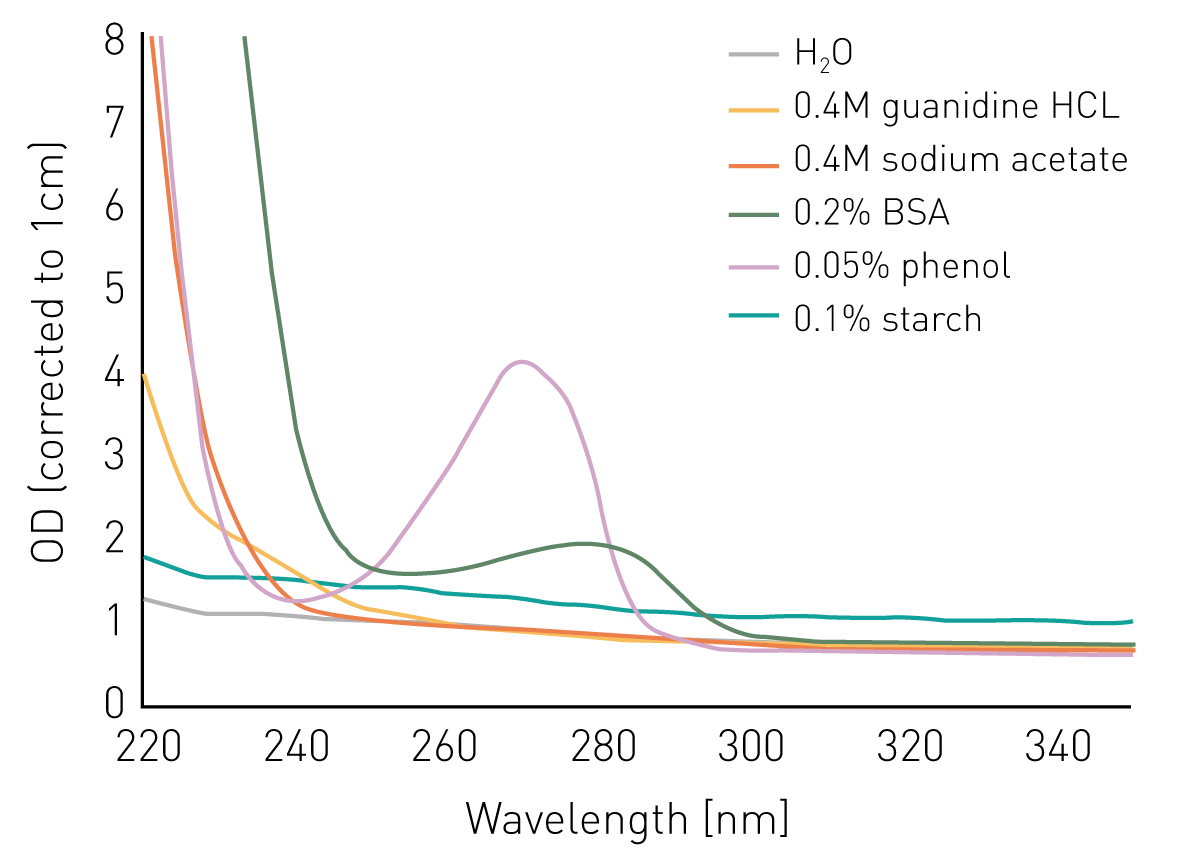 BSA/proteins absorb light substantially at 240 nm and below and display an absorbance peak at 280 nm. In contrast, a suspension of starch in water shows a relatively constant elevated absorbance intensity over all wavelengths.
Spectra of contaminated DNA
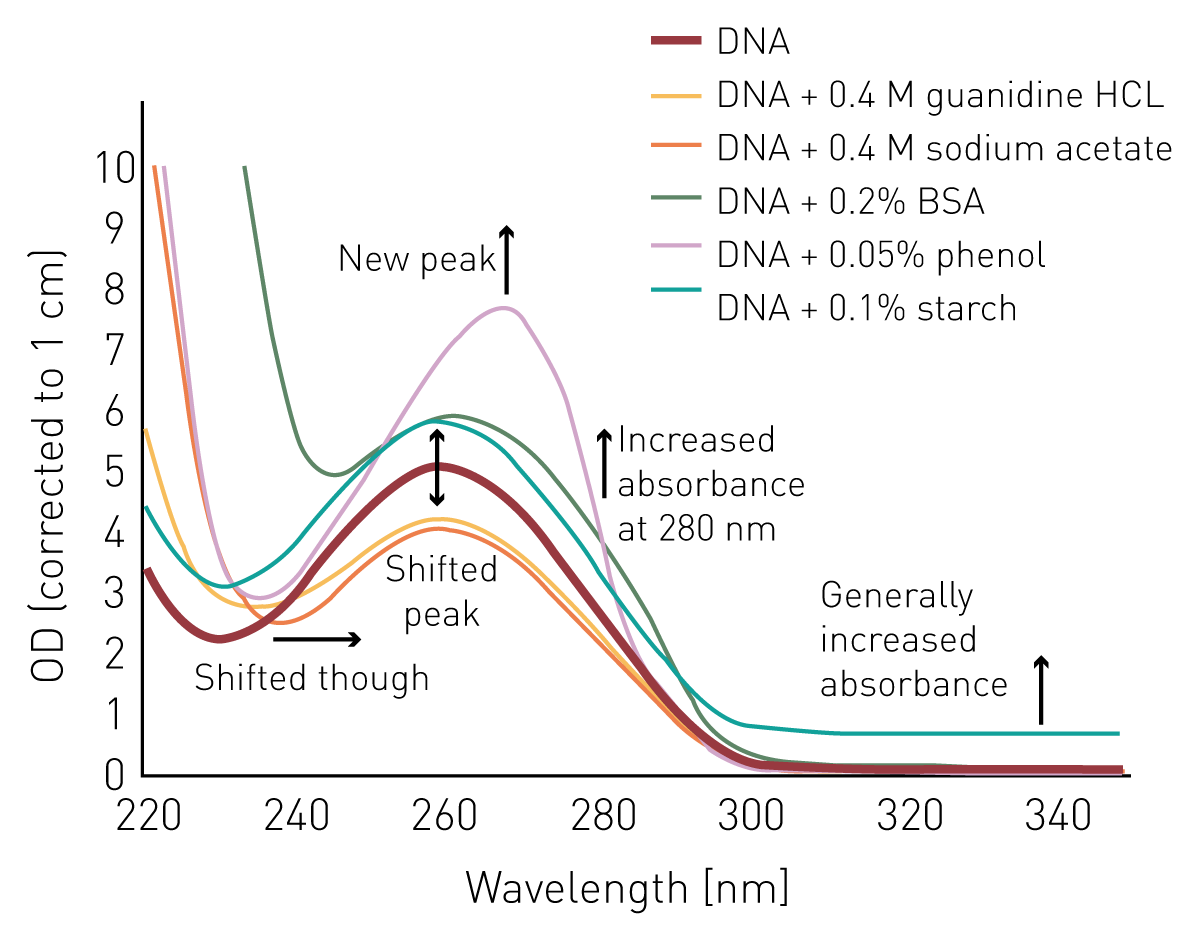
To highlight the influence of different potential contaminants on the measurement, and the calculation of DNA quantity and the DNA purity ratio, 250 µg/mL thymus DNA were either read alone in H2O or in combination with the different contaminants (figure 2). ODs were corrected to a pathlength of 1 cm. The addition of guanidine HCL and sodium acetate led to a decrease of the absorbance maximum at 260 nm. In addition, both salts led to an increased absorbance below 240 nm and a shift of the minimum from 230 nm to 240 nm. This shift is equally observed for phenol and BSA. The latter two also provide increased absorbance in the 250-280 nm range. Starch as a particulate contaminant shows slightly increased absorbance over the complete wavelength range.
Determination of DNA purity ratios and correction
The influence of potential contaminants on the absorbance spectrum of DNA can be easily monitored by the calculation of the 260/280 and the 260/230 nm DNA purity ratios (table 2). Both DNA purity ratios are calculated automatically by the application of the MARS dsDNA template. Contaminations with BSA or phenol become obvious due to the reduction of both 260/280 and 260/230 DNA purity ratios. In contrast, salts like guanidine HCL and sodium acetate mainly have an impact on the 260/230 DNA purity ratio. Particulate substances like starch only have a minor effect on the DNA purity ratios. However, the additional signal generated by such particles can be discerned by examining the absorbance at 340 nm. Unlike other substances, particles like starch show increased absorbance here.
Table 2: DNA purity ratios at 260/280 and 260/230 nm and Abs at 340 nm
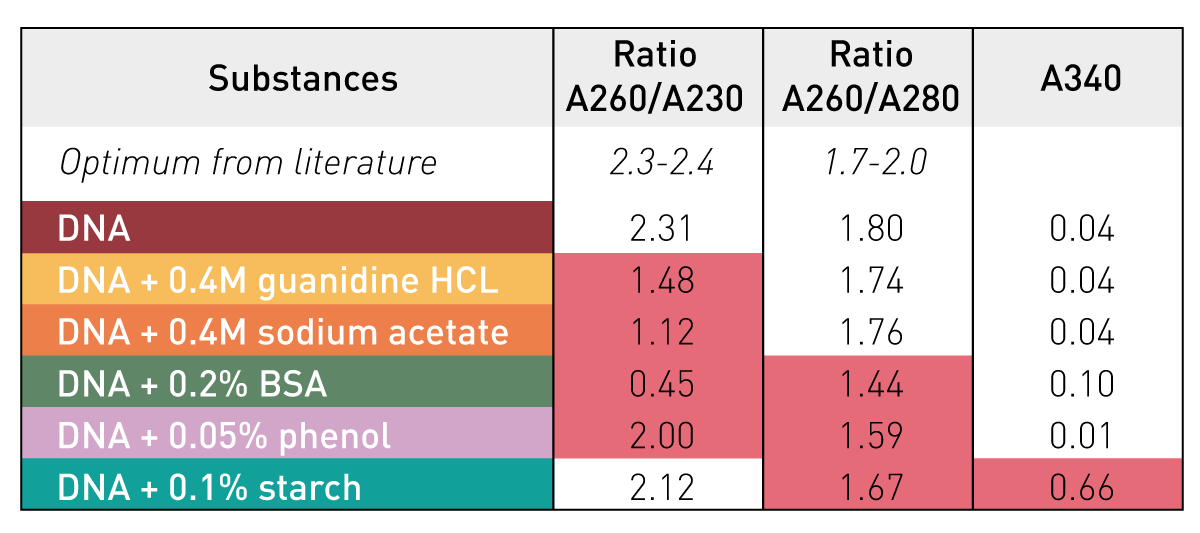
The presence of different contaminants results in a substantial miscalculation of the DNA concentration (figure 3). These miscalculations clearly underline the importance of a quality evaluation based on the DNA purity ratios before the use of extracted nucleic acids in downstream applications. If the DNA purity ratios deviate substantially from the defi ned target ranges, optimization of the isolation and processing methodology is recommended.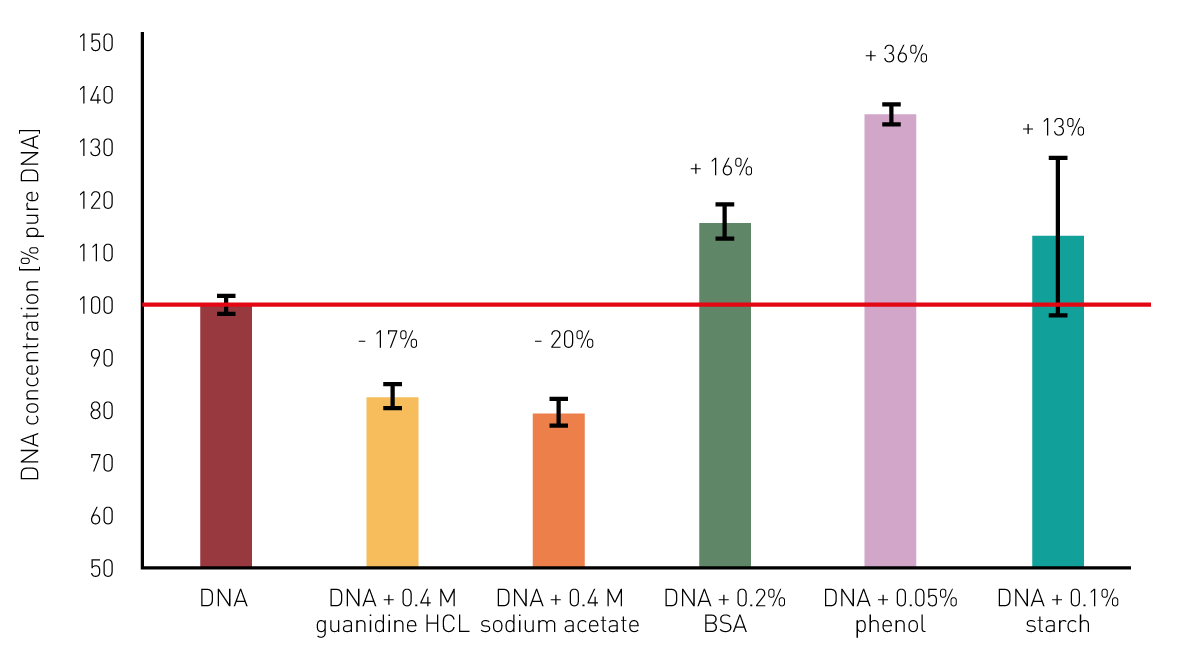 By applying the dsDNA template, the absorbance at 340 nm is automatically used for a baseline correction. This compensates for the overestimation of the DNA quantities in samples contaminated with particles. Other impurities can be easily uncovered with the MARS dsDNA template by monitoring the DNA purity ratios.
Conclusion
BMG LABTECH microplate readers equipped with a UV/vis spectrometer can record full absorbance spectra (220-1000 nm) in less than 1 s/well. Compared to the monochromator-based acquisition of the 4 relevant wavelengths, which takes about 10 s/well with a competing instrument, a significant time saving can be achieved with the spectrometer. This allows fast and easy nucleic acid quality assessment with the simultaneous recording of multiple wavelengths. The LVis Plate allows the determination of DNA purity ratios in low volumes of only 2 µL per sample. To increase throughput, measurements can also be transferred to 96, 384, or 1536-well plates. Finally, the respective MARS templates offer a fast and easy approach for data analysis to assess the quality of your DNA/RNA samples.