Introduction
Metabolic perturbations play a critical role in a variety of disease states and toxicities. Knowledge of the interplay between the two main cellular ATP generating pathways; glycolysis and oxidative phosphorylation, is therefore particularly informative when examining such per-turbations. Here we describe a time resolved fluorescence-based assay for the assessment of Extracellular Acidification which provides data on the rate of conversion of pyruvate to lactic acid and is therefore a convenient measure of glycolytic activity. Such assays are particularly informative when assessing alterations in glucose metabolism, detecting glycolytic inhibition and as a confirmatory analysis in the identification of mitochondrial dysfunction. The following protocol outlines how such measurements can be carried out on standard microtitre plates using the fluorescent pH-sensitive probe, pH-Xtra and ratiometric time resolved fluorescence detection. This approach over-comes the calibration and biocompatibility issues associated with some existing probes thereby allowing conventional cell culturing and assay procedures whilst also facilitating accurate quantitative analysis. In addition, spectral compatibility with MitoXpress, the Agilent oxygen sensitive probe, facilitates a multiplexed measurement approach providing a comprehensive metabolic assessment of test cells.
Materials & Methods
- Clear 96 well plates from Costar
- pH-Xtra probe from Agilent Technologies, PH-200-4
- Microplate reader from BMG LABTECH
Plate Preparation and Reading
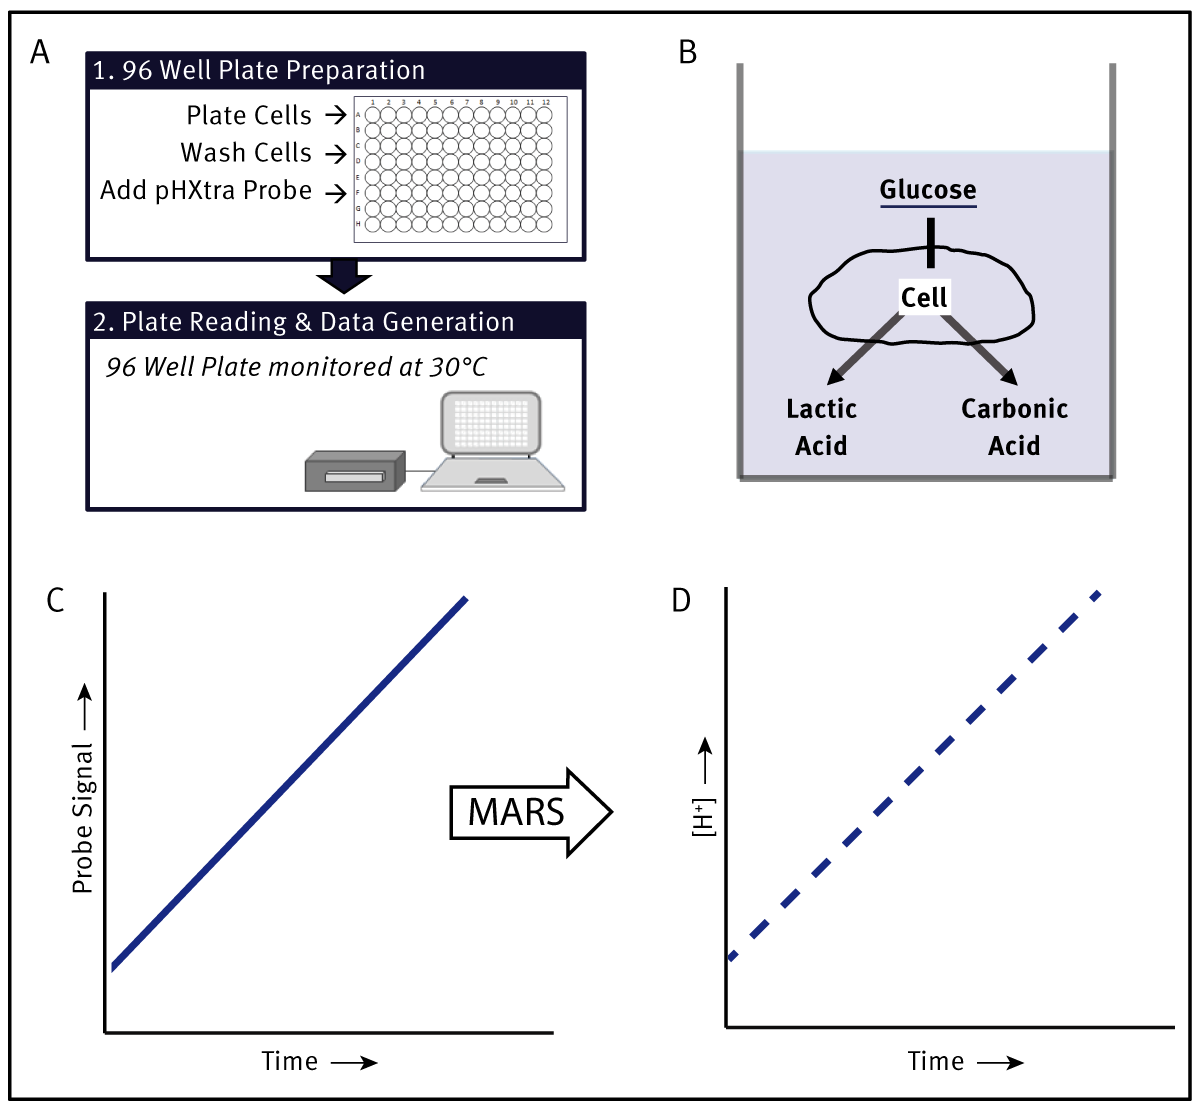
Warm instrument to measurement temperature (typically 30°C). Prepare kinetic measurement protocol to read the plate at 2-4 min intervals over 1-2 h period using the recommended ratiometric measurement parameters (more detail in the “Measurement” section). Adherent cells were either (A) plated at the indicated concentration in L15 medium and cultured in CO2-free conditions, 95%humidity at 37°C overnight or (B) cultured overnight in a standard CO2 incubator and then maintained in CO2-free conditions for 2.5 h prior to the measurement. Reconstitute pH-Xtra probe in 1 mL of Millipore water. Warm to measurement temperature. Wash cells with measurement buffer being careful not to dislodge cells from the base of the wells. Add 150 µL of the pre-warmed measurement buffer to each well and place the plate on a plate heater equilibrated to 30°C. Using a repeater pipette, add 10 µL pH-Xtra probe to each well. Follow with drug addition if applicable. Oil can be added if bulk acidifi cation data is required.
Measurement and Data Analysis
Insert the microplate into the microplate reader. Glycolytic activity is measured using the BMG LABTECH scripting function. pH-Xtra probe is measured using dual delay, time-resolved measurements. Optimal filter wavelengths are 340 TR L for excitation and TR 615 for emission. Delay times of 100 and 300 µs are used, both with a measurement window of 30 µs respectively. Plate preparation time should be kept to a minimum. When the measurement cycle is completed, remove the plate from the instrument and save the measured data to a file. These dual intensity measurements are used to calculate emission lifetime using the following function, τ=t2-t1/ Ln (D2/D1) [t=delay time, D=measured intensity value]. Lifetime signal is automatically converted to a pH and [H+] scale using a default calibration as part of the MARS template. Scripts and protocols can be obtained through your local BMG LABTECH representative and MARS templates are available to facilitate data analysis.
Results & Discussion
Monitoring Cellular Respiration
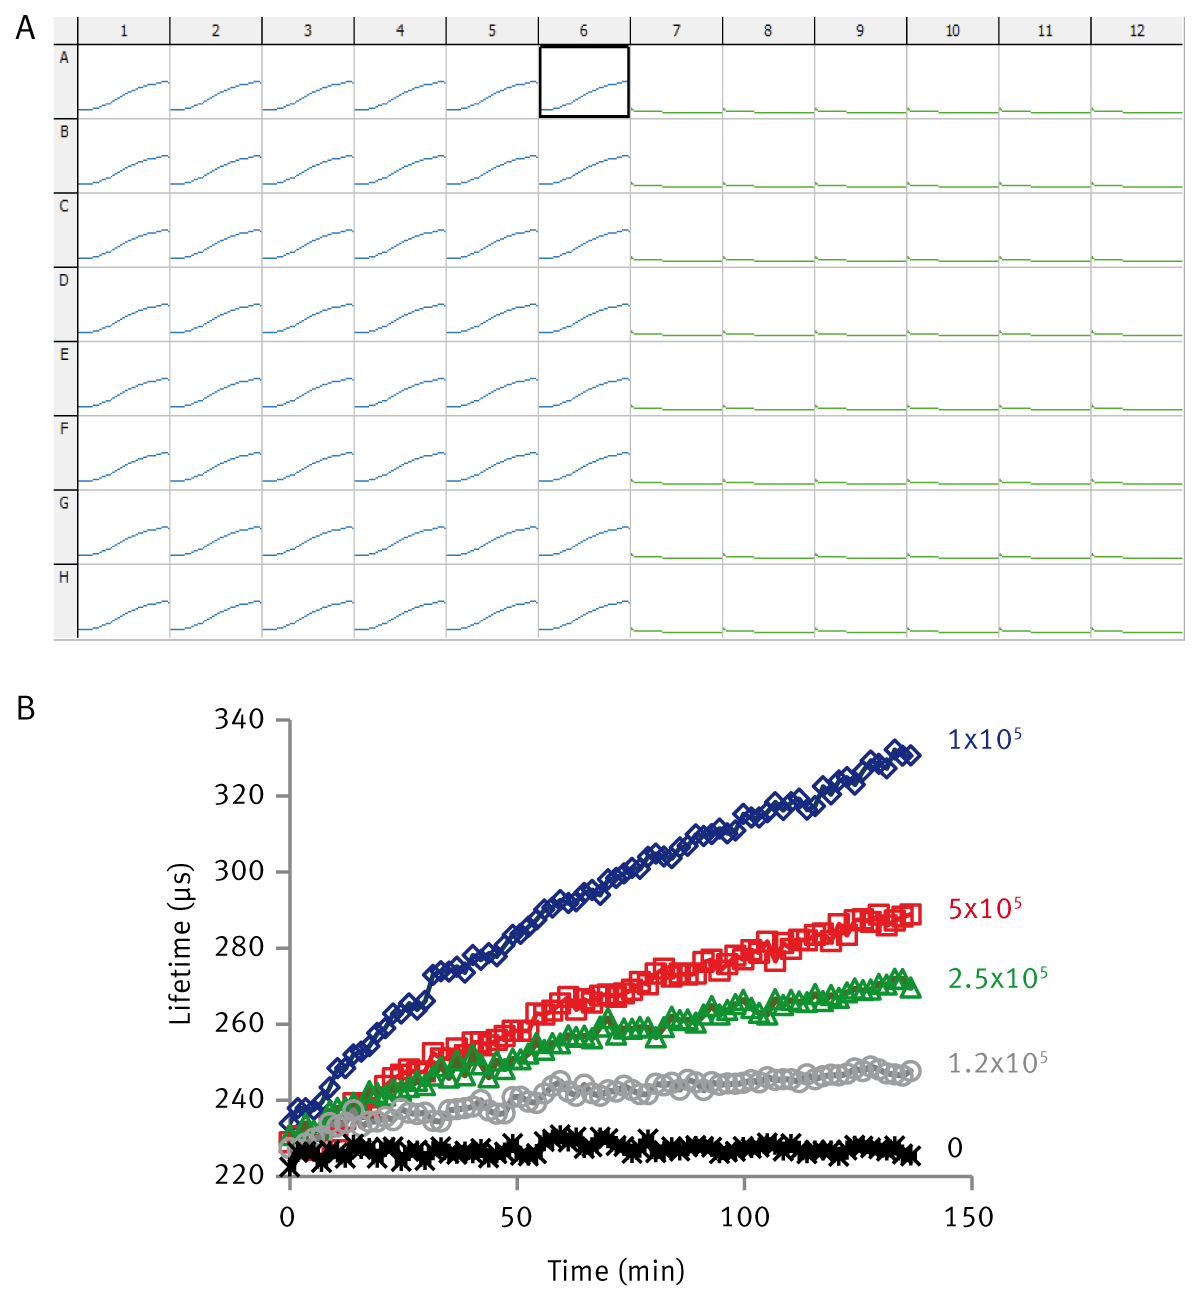
The ability of the pH–Xtra assay to assess cell respiration is illustrated in Fig. 2. A typical data read out is presented in Fig. 2A showing the parallel analysis of 96 individual samples. A serial dilution of HepG2 is presented in Fig. 2B with increasing cell numbers causing an increased rate of acidification. This is seen as in increased rate of signal change. Profi les are highly reproducible showing %CV values of the order of <5%.
Monitoring Perturbed Metabolism
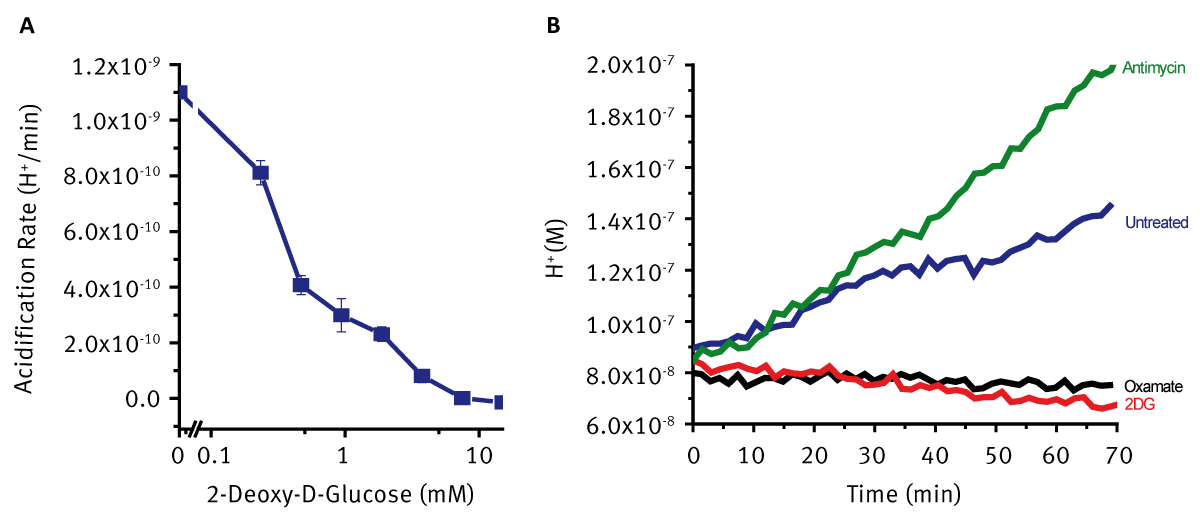
Treatment with 2DG results in reduced glucose uptake due to competitive inhibition of glucose transport. Treated cells show dramatic, immediate and dose dependant decreases in rates of extracellular acidification (Fig 3A). Mitochondrial toxins such as electron transport chain inhibitors prevent or restrict aerobic ATP generation. In many cell systems this leads to an increase in glycolytic flux to supply cellular ATP. This increased acidification can therefore be used as a confirmatory parameter when investigating drug-induced mitochondrial dysfunction. These rates are typically compared to untreated cells to determine the direction and magnitude of the effect observed. Such response can be seen in Fig 3B where treatment with Sodium Oxamate and 2DG cause the expected decreases in extracellular acidification while treatment with the Electron Transport Chain inhibitor Antimycin causes a significant increase in acidification in an attempt to maintain cellular ATP supply. This assay can be multiplexed with the Agilent MitoXpress Xtra probe to assess both Extracellular Acidification and Oxygen Consumption on the same plate.
Conclusion
- Analysis of cellular glycolytic flux is possible on standard 96 well plates by measuring rates of extracellular acidification.
- The ratiometric measurement approach facilitated by the pHXtra probe provides a robust assay readout.
- Such measurements allow convenient cellular metabolic characterisations.
- When assessed alongside an analysis of oxygen consumption a detailed analysis of mitochondrial function is possible
- Data analysis is greatly simplified using MARS data analysis templates
Supplemental Information
- When culturing cells in a standard 5% CO2 environment the polystyrene body of a standard microtitre plate absorbs CO2. If a plate is moved immediately from 5% CO2 to the measurement chamber this CO2 will diffuse into the sample causing significant acidification. To circumvent this, cells may be cultured in CO2-free conditions in specially formulated media such as L-15, or cultured in standard media and moved to a CO2-free environment 2h prior to measurement. The procedure as described in the Agilent user guide.
- Measurement Buffer 1: 1mM K-phosphate, 20mM Glucose, 0.07M NaCl and 0.05M KCl, 0.8mM, MgSO4, 2.4mM CaCl2, pH 7.4. Measurement Buffer DMEM Base, 1.85g/l NaCl, 10ml 100x GlutaMax, 10mL 100mM Sodium Pyruvate, 15 mg Phenol Red, 25mM glucose.
- Acidification in unsealed samples is due almost entirely to lactate conversion while, in sealed samples there is a strong contribution from carbonic acid due to trapped CO2 reflecting Krebs cycle activity.