Introduction
The Oxygen Radical Antioxidant Capacity (ORAC) assay is a laboratory test that measures the antioxidant capacity of foods per weight. It is commonly used in conjunction with assays like: TEAC, FRAP, TRAP, Folin, DPPH and CUPRAC.1 These tests are frequently used to assess the effectiveness of foods in neutralising free radicals.
Free radicals are generated in the body during normal metabolic processes such as eating and breathing, as well as external factors like pollution and smoking. Overgeneration or inability to inactivate free radicals via normal metabolic processes can lead to various disease conditions (diabetes, renal ischaemia, atherosclerosis, cancer) and premature ageing in general. The types of food we eat with their varying antioxidant capacity can help to lower the concentration of free radicals in the body. While there is limited data to suggest that there is a direct correlation between the antioxidant capacity of a food and better health effects, it is generally believed that eating foods that are high in antioxidants (fruits and vegetables) is benefi cial for one’s health.2
The ORAC assay therefore remains a valuable research tool in assessing the antioxidant capacity of foods.
Assay Principle

The ORAC assay simply involves the reaction of fluorescein with AAPH (Fig. 1). As the reaction progresses a loss of fluorescence is observed. If the sample doesn´t show an antioxidant capacity (just buffer) the area under the fluorescence curve (AUC) represents the blank. Together with the blank, a standard curve of the antioxidant capacity is also constructed, by reacting fluorescein and AAPH in the presence of a 2x serial dilution of Trolox (Vitamin E equivalent, 800 µM - 25 µM). Finally, in addition to the blank and Trolox standard curve, a 10x dilution series of the food samples is prepared and allowed to react with fl uorescein and AAPH under the same conditions as TROLOX standards and blank. The AUC is also determined for these food samples. The specific concentration of food sample that falls within the Trolox standard curve is used to give the respective antioxidant capacity value, expressed as µM TE (Trolox equivalents)/100 g of sample.
Materials & Methods
- 96-well Black microplates, NUNC
- CLARIOstar® Plus
- Reagents: Fluorescein sodium; 2,2′-Azobis (2-methylpropionamidine) dihydrochloride (AAPH); Trolox, Sigma-Aldrich; Phosphate buffer solution (PBS), pH 7.4
- Samples: Leaf extract; Botanical beverage; Fruit juice; Mixed berries
Experimental Procedure
Fluorescein solution (10 nM), Trolox standards (800 µM – 25 µM, 2x serial dilution) and AAPH solution (240mM) were prepared in PBS buffer pH 7.4.
Stock solutions of food products or extracts were prepared in PBS buffer. 1) Botanical beverage; was prepared by dissolving 8 g in 150 mL buffer (18.75x dilution). 2) A leaf extract; (2 mg) was dissolved in buffer (10 mL, 5000x dilution). 3) Fruit juice; was used neat. 4) Mixed berry beverage; was used neat. 10x serial dilutions of all these stock solutions were also prepared ranging from 10x to 100000x.
Plate preparation
To each active well was added 25 µL of either buffer (for the blank) or Trolox standards or samples (stock solutions and 10x - 100000x serial dilutions) in triplicate. The plate was placed into the CLARIOstar Plus plate reader with incubation at 37 °C, and the experiment for the determination of the antioxidant capacity was started. The CLARIOstar Plus was programmed to read the plate every 90 s, with two separate injections of; 1) Fluorescein (10 nM, 150 mL) to all wells in the 1st cycle and 2) AAPH (25 µL) to all wells in the 4th cycle of 125 cycles.
Instrument Settings
| Optic settings |
Fluorescence, plate mode kinetic | |
| LVF monochromator |
Fluorescein | |
| Ex 483.14 | ||
| Dichroic 502.5 | ||
| Em 530-30 | ||
| General settings | Number of flashes 10 | |
| Settling time 0.5 s |
||
| Kinetic settings | Number of cycles 125 | |
| Cycle time 90 s |
||
| Incubation | 37 °C | |
| Gain |
Enhanced dynamic range- auto gain |
|
| Focal height | Auto focus | |
Results & Discussion
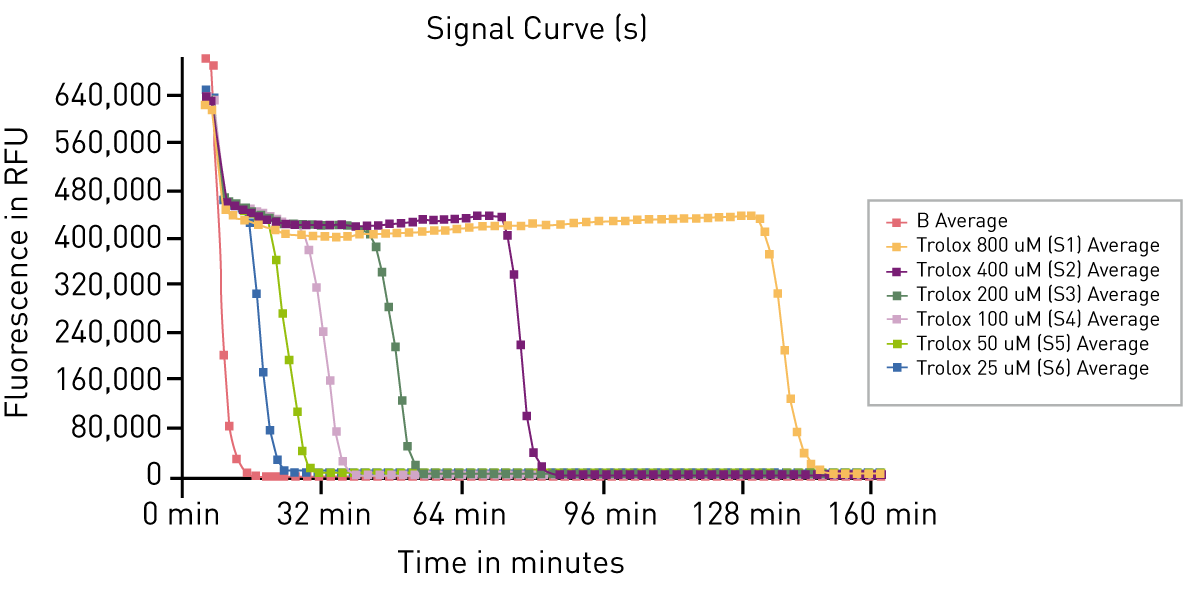
From the raw data of blank (red) and Trolox standards (fig. 2) it is apparent, that fluorescence decay decreases with higher concentrations of Trolox.
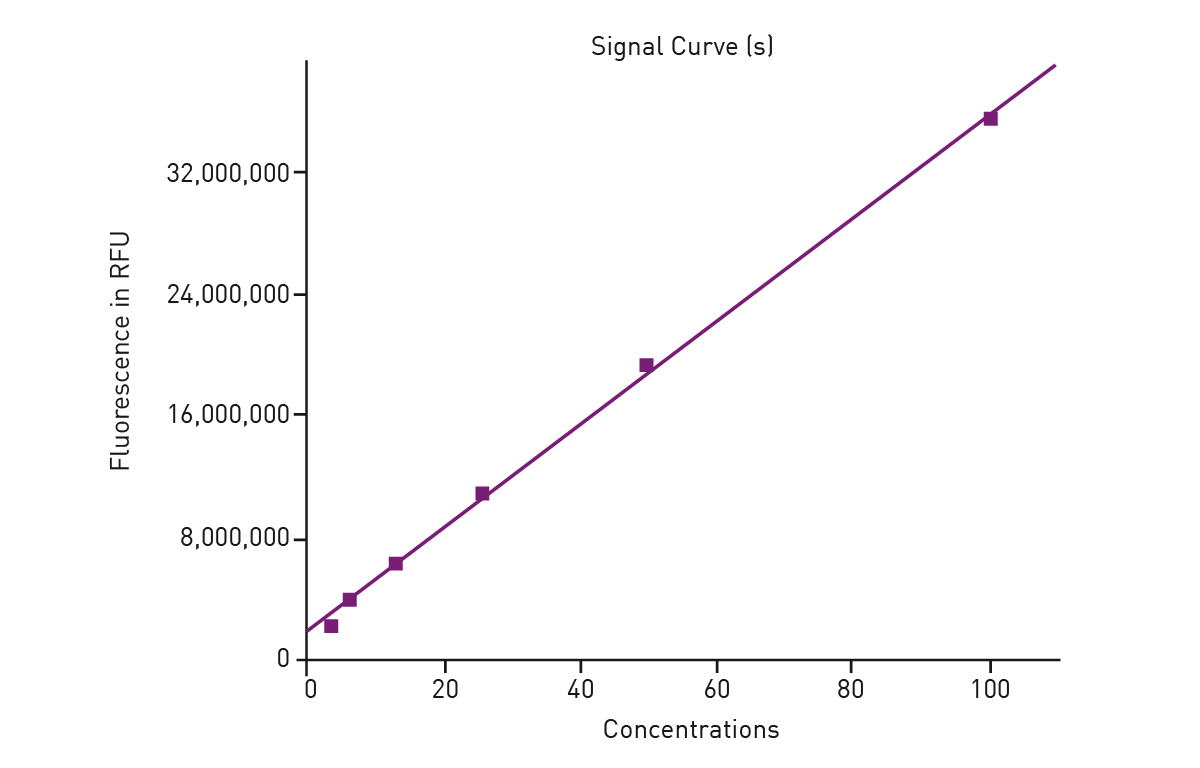
The AUC was calculated for all Trolox standards based on blank-subtracted data. AUC data was then used to generate a standard curve of the antioxidant capacity based on Trolox. (Fig. 3).
The Trolox standard curve was used to convert AUC data for all leaf extract, botanical beverage, fruit juice and mixed berry sample dilutions to Trolox equivalents (TE). For each of the four separate products, the dilutions that fell within the standard curve were used to calculate the antioxidant capacity of the samples.
Examples: For leaf extract, the antioxidant capacity of the 10x dilution was found to fall on the Trolox curve. This corresponds with an antioxidant capacity of 98.136 µM TE/Kg (average of 3 replicates), which needs to be multiplied by 10 and 5000 to get back to the antioxidant capacity of the original powder, ie. 4906,800 µM TE/Kg or 490,680 µM TE/100 g of original powder.
For the mixed berry beverage, it was found that the 100x dilution sample gave an antioxidant capacity value of 213.2 µM TE/L (average of triplicates), from the standard curve. This was multiplied by 100 to get the value for the neat drink, i.e. 21,320 µM TE/L of beverage or 2,132 µM TE/100 mL of beverage.
The final antioxidant capacity values for the four products used for this study are shown in table 1 and give useful data on the relative amounts of antioxidants present in these foods.
| Samples | Final antioxidant capacity values |
| Leaf extract | 490,680 µM TE/100 g |
| Botanical beverage (pre-mixed powder) | 13,737 µM TE/100 g |
| Mixed berry beverage | 2,132 µM TE/100 mL |
| Fruit juice | 596 µM TE/100 mL |
Conclusion
The determination of the antioxidant capacity with ORAC assays requires substantial data calculations to give a final value. Here, the MARS Data Analysis Software has proven to be very useful. The software can perform all the calculations automatically to provide values of the antioxidant capacity at a single click, allowing substantial time savings for multiple determinations.
The data presented also shows that the CLARIOstar Plus is eminently suitable for such assays to determine the antioxidant capacity. The reader is equipped with a patented linear variable filter (LVF) monochromator for fluorescence, onboard injectors for dispensing solution as required, heating and shaking. It also features auto-focus and auto-gain capabilities for easy protocol setup.
References
- Lopez-Alarcon C., Denicola A., Evaluating the antioxidant capacity of natural products: A review on chemical and cellular based assays. Analytica Chimica Acta, 2013, 763, 1-10.
- Prior R.L., Oxygen radical absorbance capacity (ORAC): New horizons in relating dietary antioxidants/bioactives and health benefi ts: Journal of functional foods, 2015, 8, 797-810.
- For the description of a Cellular Antioxidant Assay see; BMG LABTECH Application Note No. 280.